August 2018 SW Climate Outlook - Monsoon Tracker
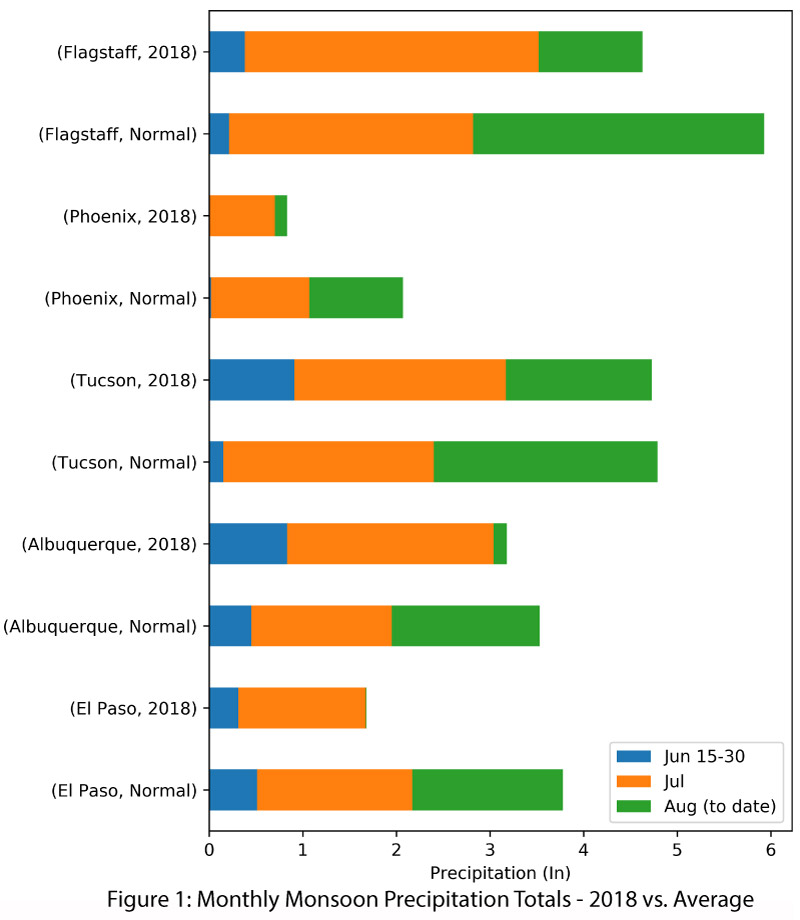
Monsoon precipitation totals vary considerably across the Southwest. Monthly totals for select locations reveal near or below-average amounts compared to long-term averages (Fig. 1). There are widespread regions with above-average totals as well (see p. 5), revealing the challenge of characterizing monsoon performance using single stations. The monthly breakdown illustrates the sporadic nature of monsoon activity that affects how each locale reaches its seasonal totals and demonstrates how particular events can boost monthly totals in some locations but not others—such as how TS Bud in June affected Tucson but not Phoenix. Daily precipitation plots for the same stations (Fig. 2) further demonstrates the intermittent nature of monsoon precipitation and distinguishes areas that have had frequent events (e.g. Tucson, Flagstaff) from those with fewer ones (e.g. Phoenix, El Paso).
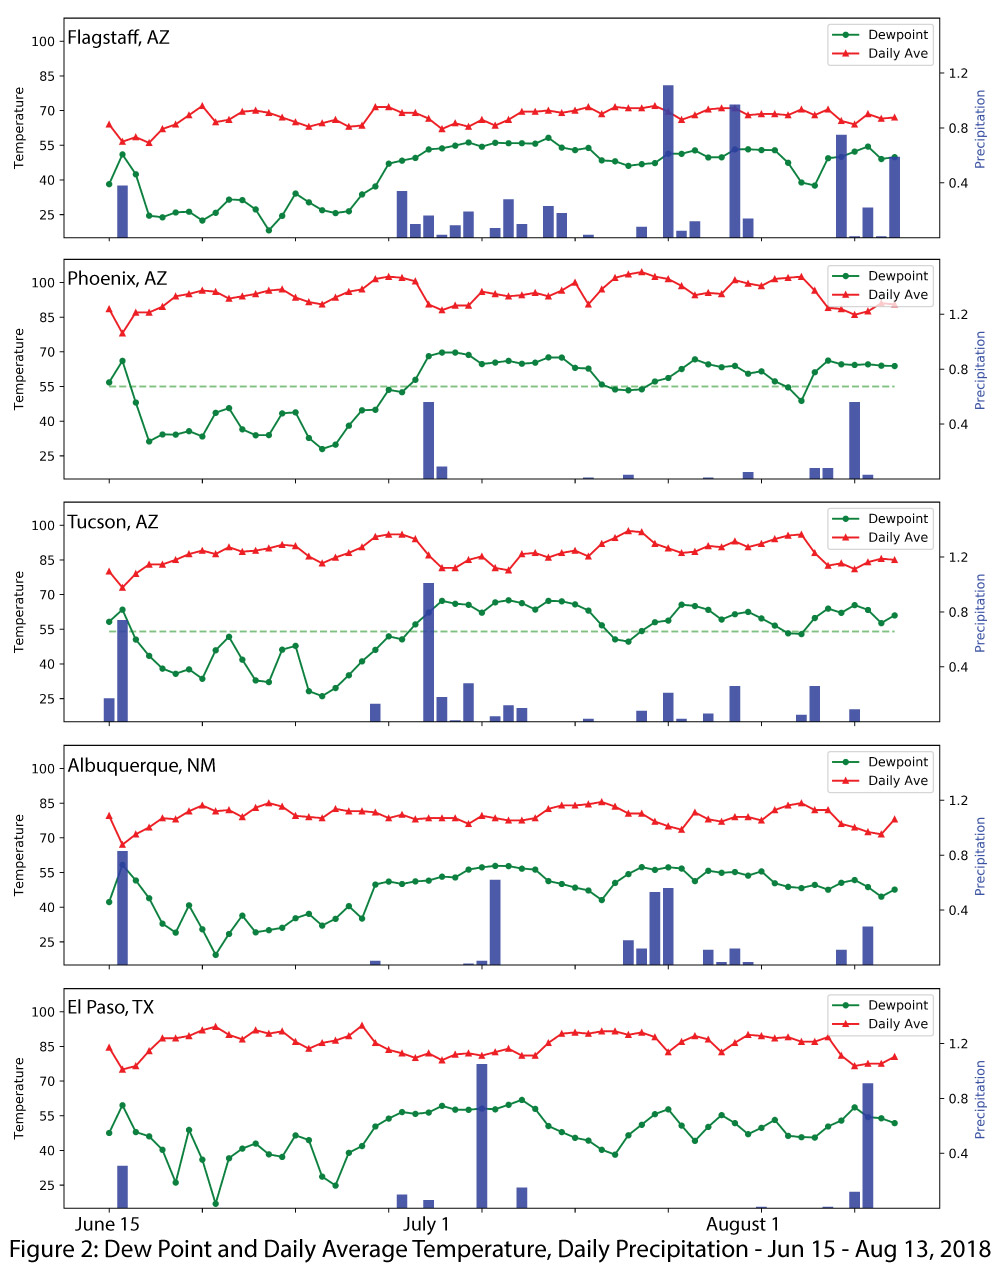
As discussed last month, increasing dewpoint temperature was the old metric by which monsoon onset was determined. This year, the onset of monsoon precipitation was relatively closely aligned with increasing dewpoint temperatures in early July, but the precipitation/dewpoint relationship since then illustrates why elevated dewpoint is an imperfect measure of likely precipitation. Although dewpoint temperatures were elevated for much of the last month, precipitation was not consistent. In fact, sustained periods of high dewpoints without precipitation led to extreme heat warnings in the region, with heat indices over 110 degrees in some locations, and persistent warm overnight temperatures. Without storm-induced cooling, elevated dewpoint temperatures can be downright miserable, especially for households that rely on evaporative coolers for interior climate control.
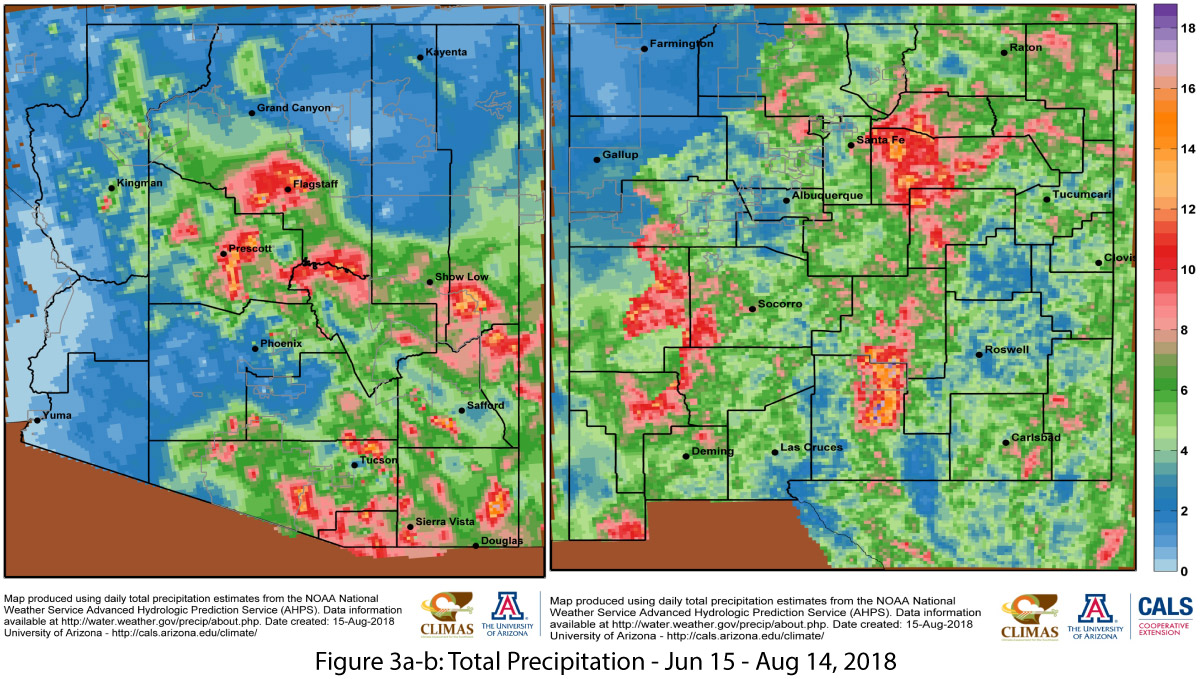
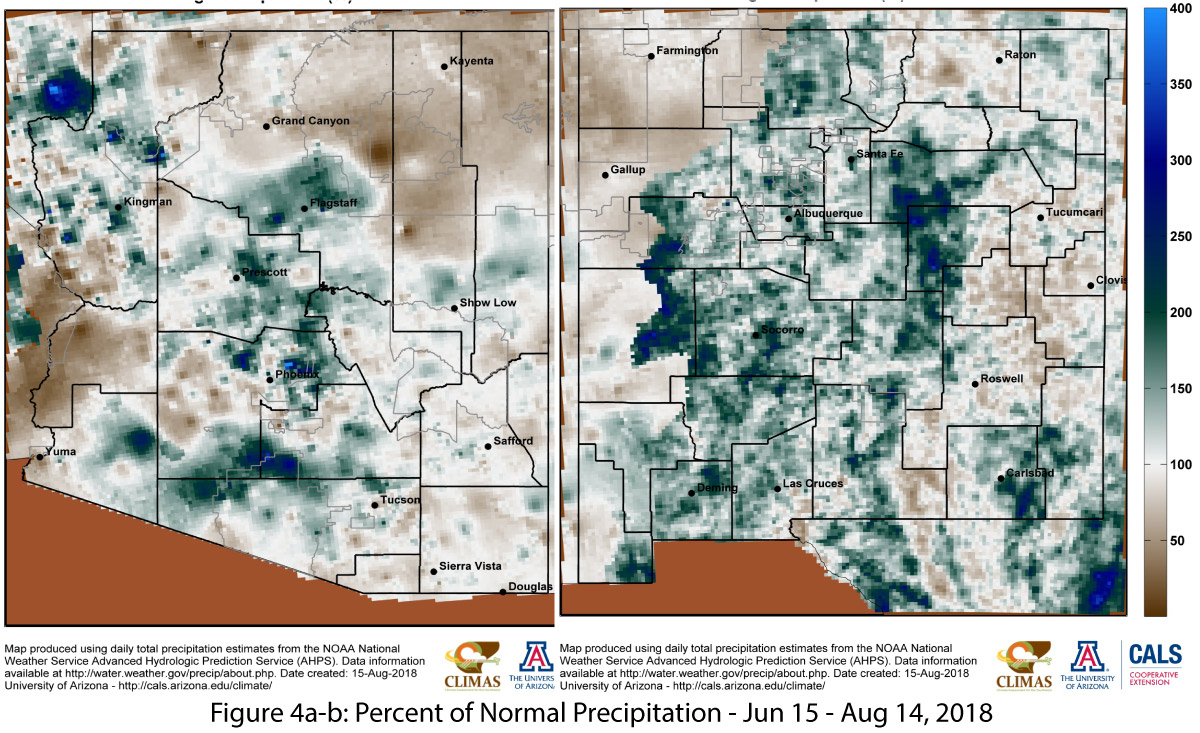
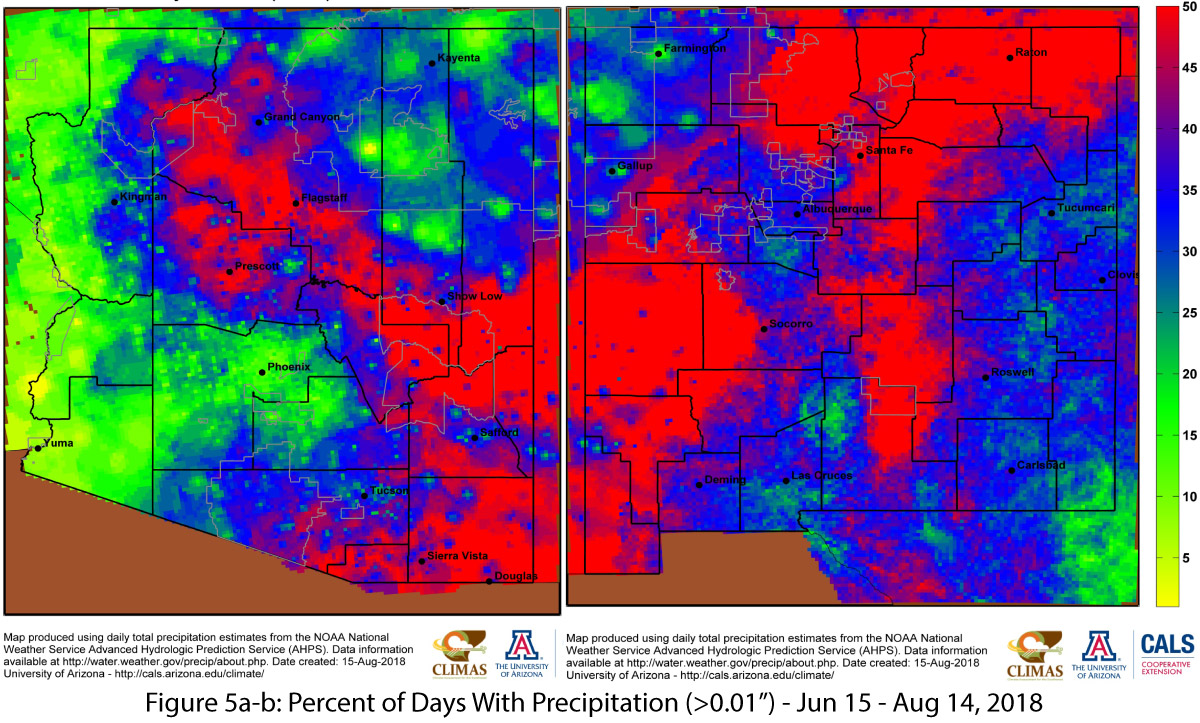
Seasonal totals to date (Fig. 3), the percent of normal precipitation (Fig. 4) and percent of days with rain (Fig. 5) all help characterize the spatial variability and intensity of the monsoon thus far.
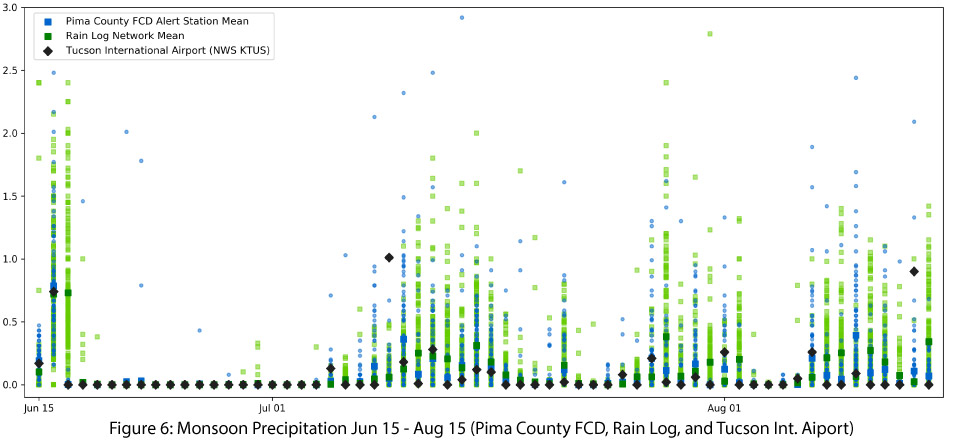
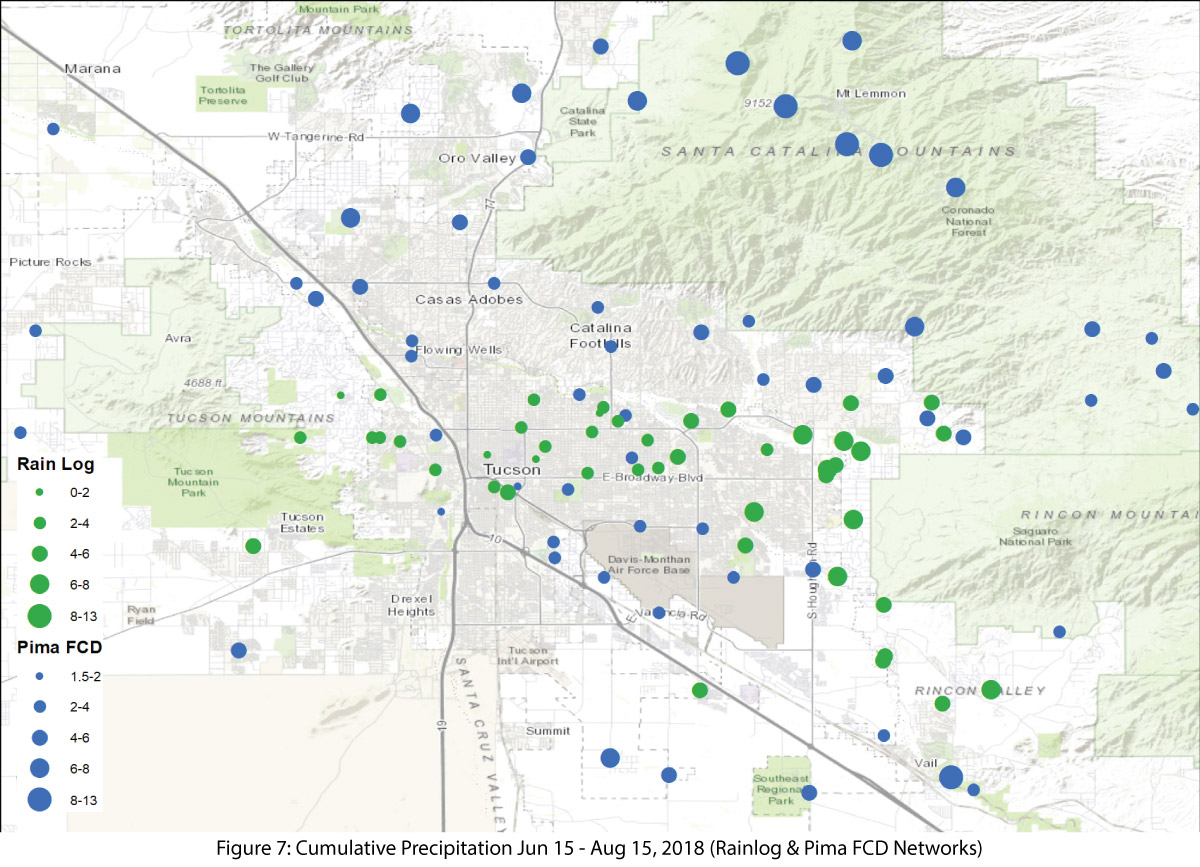
A look at monsoon precipitation across the Tucson metropolitan area illustrates the spatial heterogeneity of monsoon events. Some areas receive frequent and/or abundant precipitation, while others–often nearby–do not (Figs. 6-7). Individual stations (e.g. the Tucson Airport) track long-term comparisons to normal at that single location, but can not capture this variability. Higher elevation areas are expected to receive more precipitation, but the range found in lower elevation locations highlights how daily and cumulative totals can vary across a remarkably short distance.
Online Resources
-
Figures 1-2 - CLIMAS: Climate Assessment for the Southwest - climas.arizona.edu
- Figure 1 Data: wrh.noaa.gov/twc/monsoon/monsoon_elp.php
- Figure 2 Data: mesowest.utah.edu/
- Figures 3-5 - UA Climate Science Application Program - cals.arizona.edu/climate
-
Figures 6-7 - CLIMAS: Climate Assessment for the Southwest - climas.arizona.edu
- Figures 6-7 Data: RainLog.org & Pima County Flood Control District