Southwest Climate Outlook August 2018 - Climate Summary
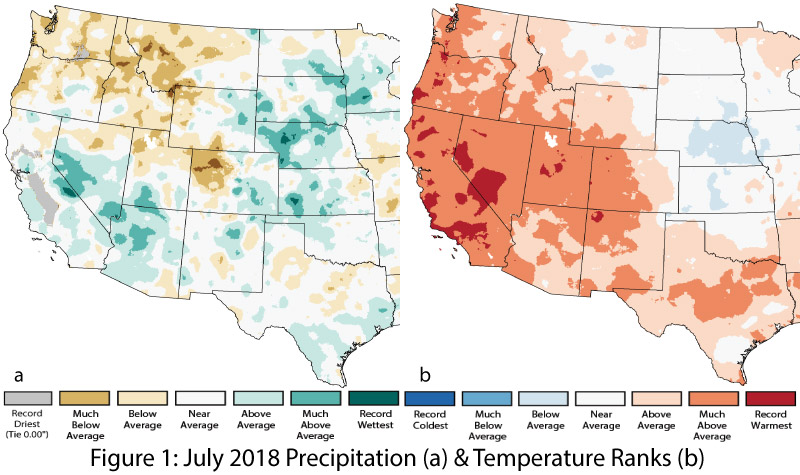
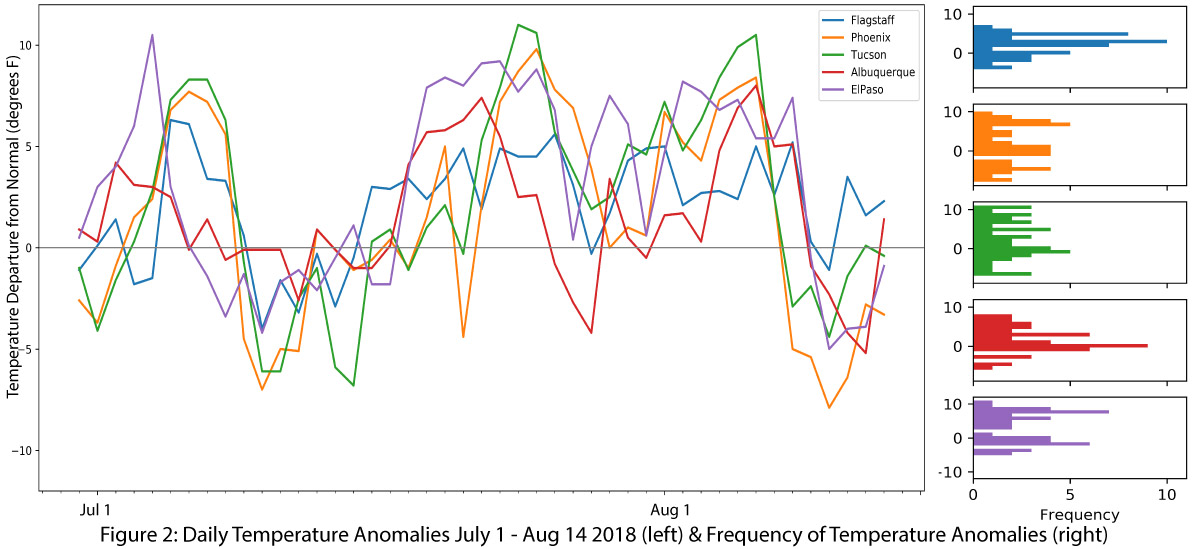
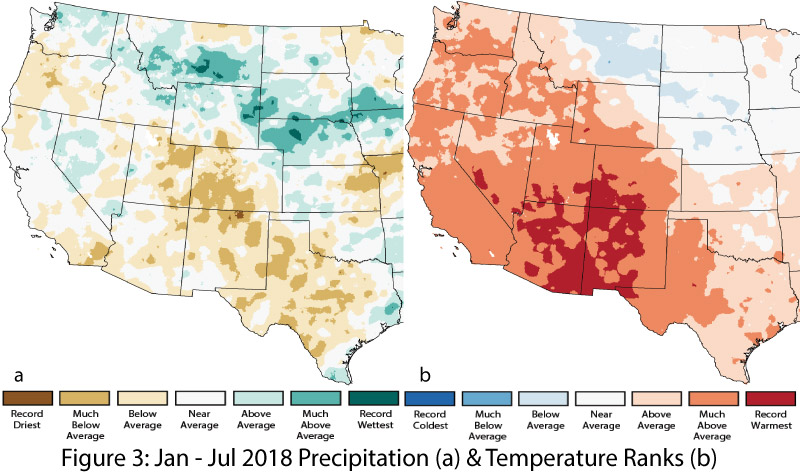
Precipitation and Temperature: Precipitation in July ranged from below average to much-above average in Arizona and New Mexico (Fig. 1a), illustrating the extent to which monsoon precipitation varies across the region. July temperatures were warmer than average in nearly all of Arizona and New Mexico (Fig. 1b), and since July 1, most of the daily temperature anomalies (deviations above or below the average temperature) have been warmer across the region (Fig. 2). Year-to-date precipitation is above average to record driest while year-to-date temperatures have been much-above average to record warmest (Fig. 3a-b).
Monsoon Tracker: The monsoon is going strong with prevailing conditions favorable to storm activity. Arizona and New Mexico have had nearly daily storms since early July, but as is typical this time of year, the actual precipitation totals vary considerably across the Southwest at regional and even local scales due to the intense but localized nature of monsoon events (see Monsoon Tracker for details).
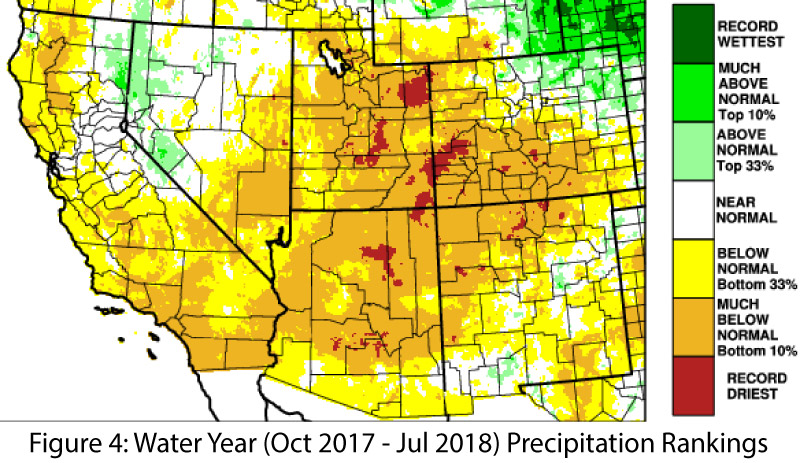
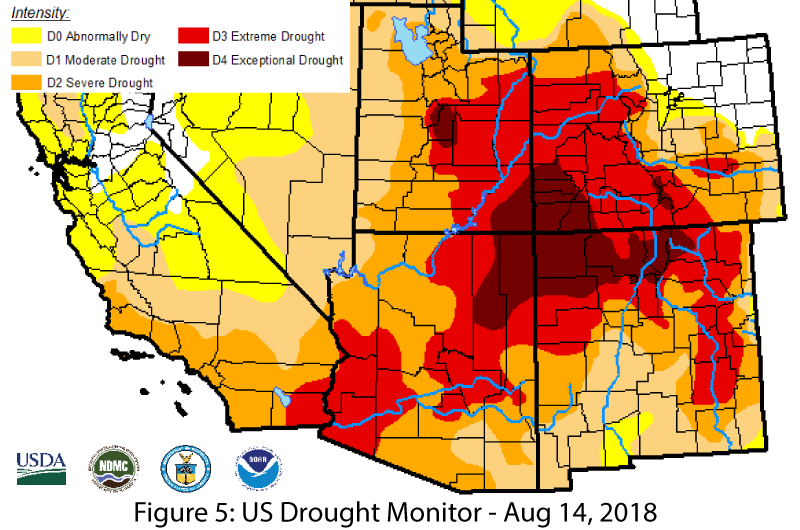
Drought: Water-year precipitation to date reveals persistent cumulative deficits across nearly all of Arizona and much of New Mexico (Fig. 4). The Aug. 14 USDM responded to recent precipitation and scaled back some of the drought designations in southern Arizona and New Mexico (Fig. 5), although the Four Corners region remains in exceptional drought (D4). Drought experts continue to discuss the extent to which short-term upticks in summer precipitation can truly reverse months of deficit. This is our annual conundrum: How much does monsoon precipitation mitigate drought conditions in the Southwest? High-intensity precipitation is subject to loss via runoff and evaporation, yet it can help quickly recharge reservoir storage and irrigate summer forage crops that are dependent on the timing of the precipitation, thus the answer depends on what type of drought you are tracking. Furthermore, the spatial variability of monsoon events can lead to a sense of winners and losers for monthly and seasonal totals during the monsoon, even while both are still subject to the longer-term, cool-season precipitation deficits.
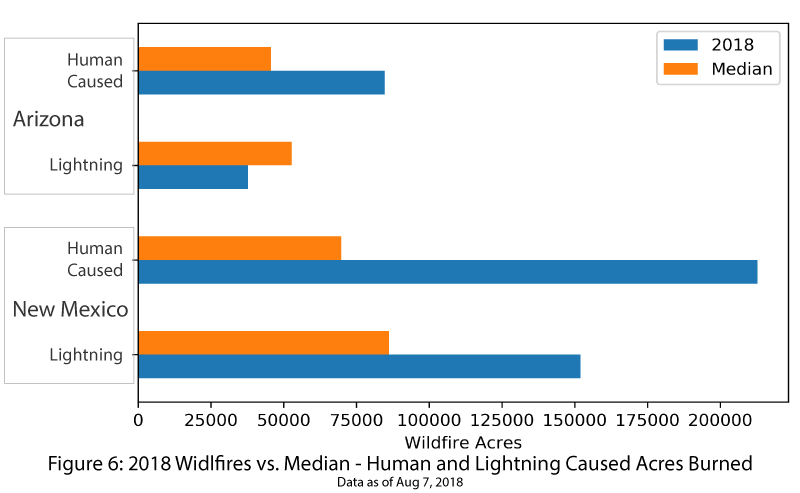
Wildfire: Widespread moisture and monsoon activity helped tamp down fire risk in July and August (so far). The period of highest wildfire risk is over for the Southwest, but convective activity associated with the monsoon does bring additional ignition sources for wildfire, and wildfire totals in Arizona and New Mexico as of Aug. 7 saw modest increases in lightning-caused fires over the last month (see Fig. 6 for a seasonal summary).
El Niño Tracker: Neutral conditions are present in oceanic and atmospheric indicators and are expected to remain neutral through summer. Seasonal outlooks indicate increasing chances of an El Niño event in 2018, with El Niño conditions likely to emerge by fall or winter (see ENSO Tracker for details). Above-average winter precipitation is one characteristic of El Niño in the Southwest, but if the event develops earlier rather than later this fall, it also could help enhance eastern Pacific tropical storm activity. This in turn could promote increased precipitation in the Southwest this fall, especially if these tropical storms bend back into the Southwest and drive moisture into the region. By way of comparison, last year—a La Niña year—brought little tropical storm activity to augment precipitation totals for either the monsoon or the fall season.
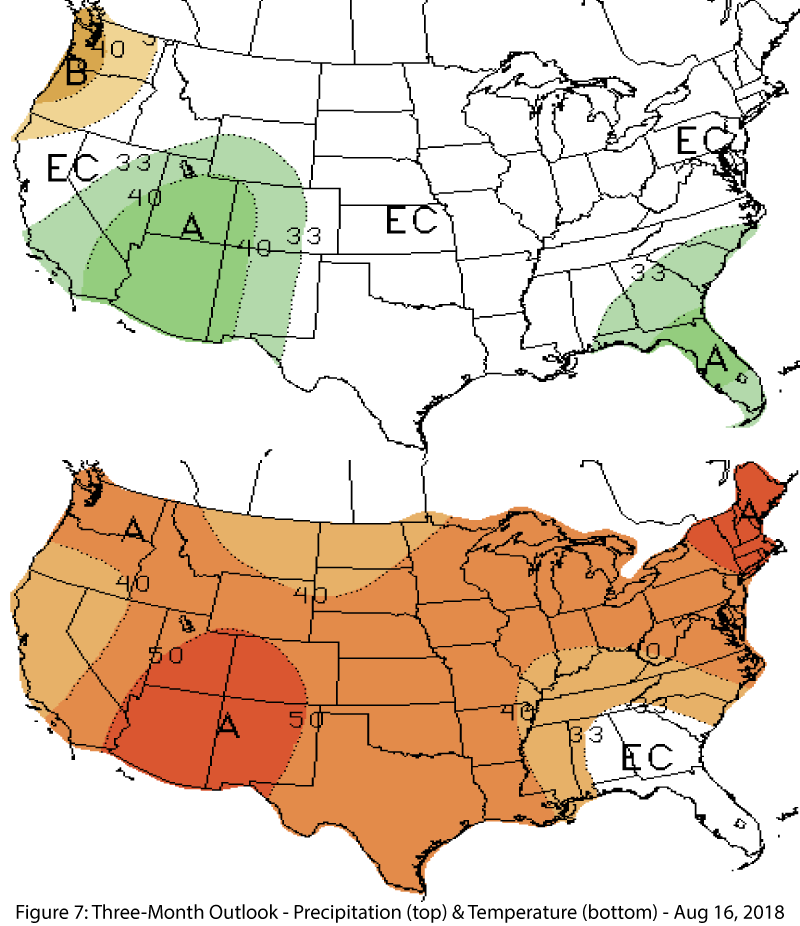
Precipitation and Temperature Forecast: The three-month outlook for August through November calls for increased chances of above-normal precipitation in Arizona and most of New Mexico (Fig. 7, top), and increased chances of above-average temperatures for the entire western United States (Fig. 7, bottom).
Online Resources
- Figures 1,3 - National Centers for Environmental Information - ncei.noaa.gov
- Figures 2,6 - Climate Assessment for the SW - climas.arizona.edu
- Figure 4 - Western Regional Climate Center - wrcc.dri.edu
- Figure 5 - U.S. Drought Monitor - droughtmonitor.unl.edu
- Figure 7 - NOAA - Climate Prediction Center - cpc.ncep.noaa.gov