July 2018 SW Climate Outlook - Monsoon Tracker
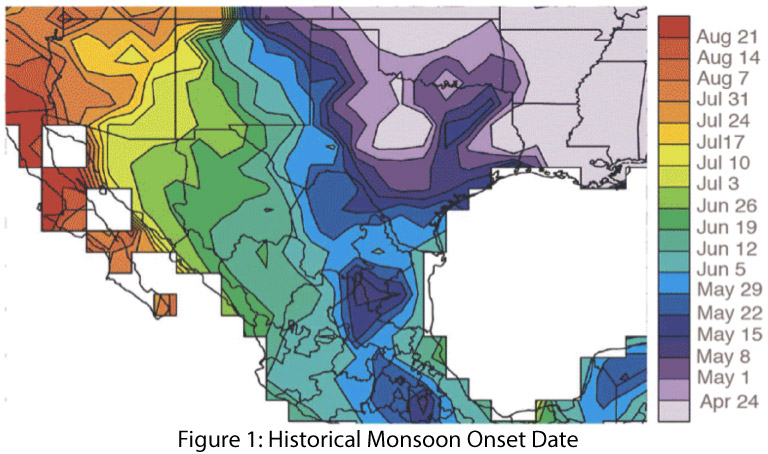
In 2008, the National Weather Service (NWS) changed the definition of the start of the Southwest monsoon from a variable date based on locally measured conditions to a fixed date of June 15 (and a fixed end date of Sept 30). Prior to 2008, the flexible start date reflected the seasonal progression of the monsoon, with a considerable temporal gradient across the region (Fig. 1).
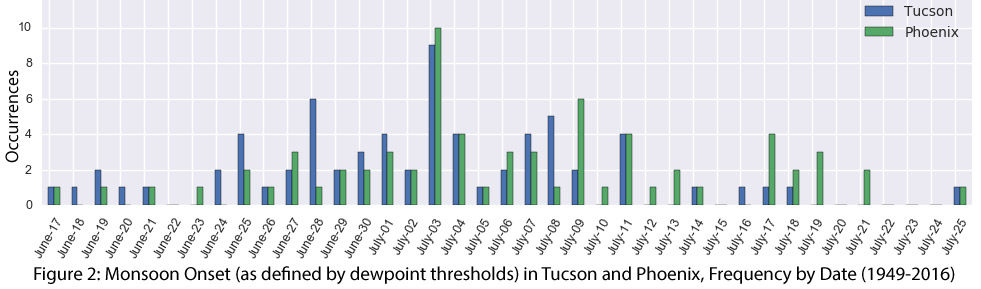
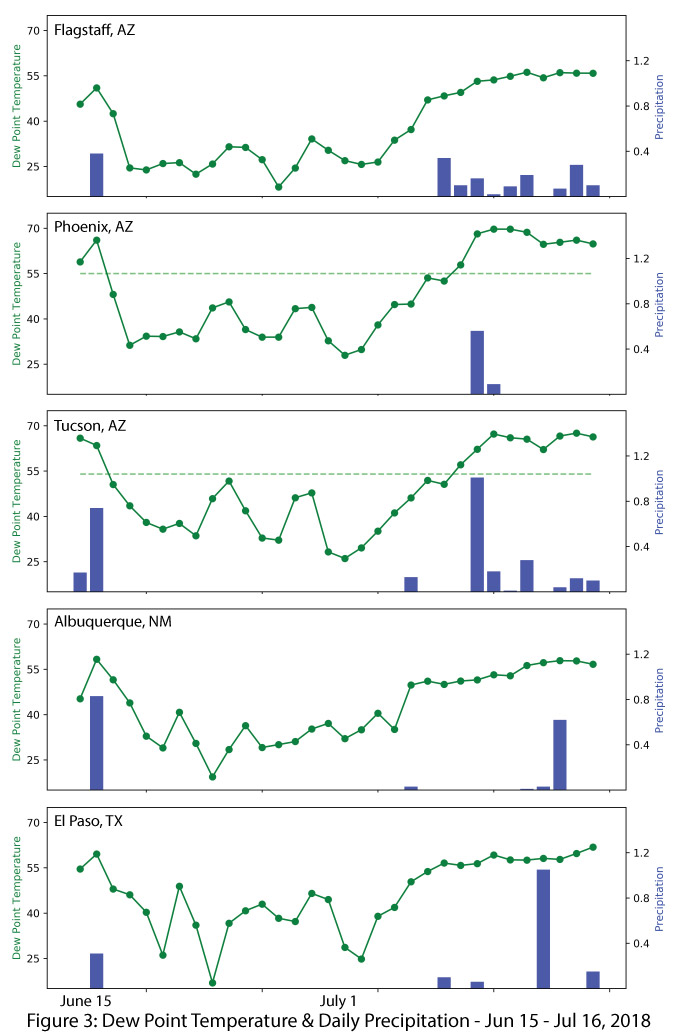
In Southern Arizona, the monsoon start date was based on the average daily dewpoint temperature. Phoenix and Tucson NWS offices used the criteria of three consecutive days of daily average dewpoint temperature above a threshold (55 degrees in Phoenix, 54 degrees in Tucson) to define the start date of the monsoon (Fig. 2). Using that definition, the monsoon began in Tucson and Phoenix on July 8 this year. While an imperfect measure, this increase in dewpoint temperature contextualizes the slightly later-than-average start to monsoon activity compared to climatology, and roughly corresponds with upticks in precipitation activity across the Southwest (Fig. 3). Despite the relatively late start, the monsoon is now in full swing.
The seasonal totals to date (Fig. 4 on p. 5), the percent of normal precipitation (Fig. 5 on p. 5) and percent of days with rain (Fig. 6 on p. 5) all help characterize the spatial variability and intensity of the monsoon thus far. Tucson’s monsoon precipitation (p. 6) illustrates the amount of variability that can occur at a municipal scale.
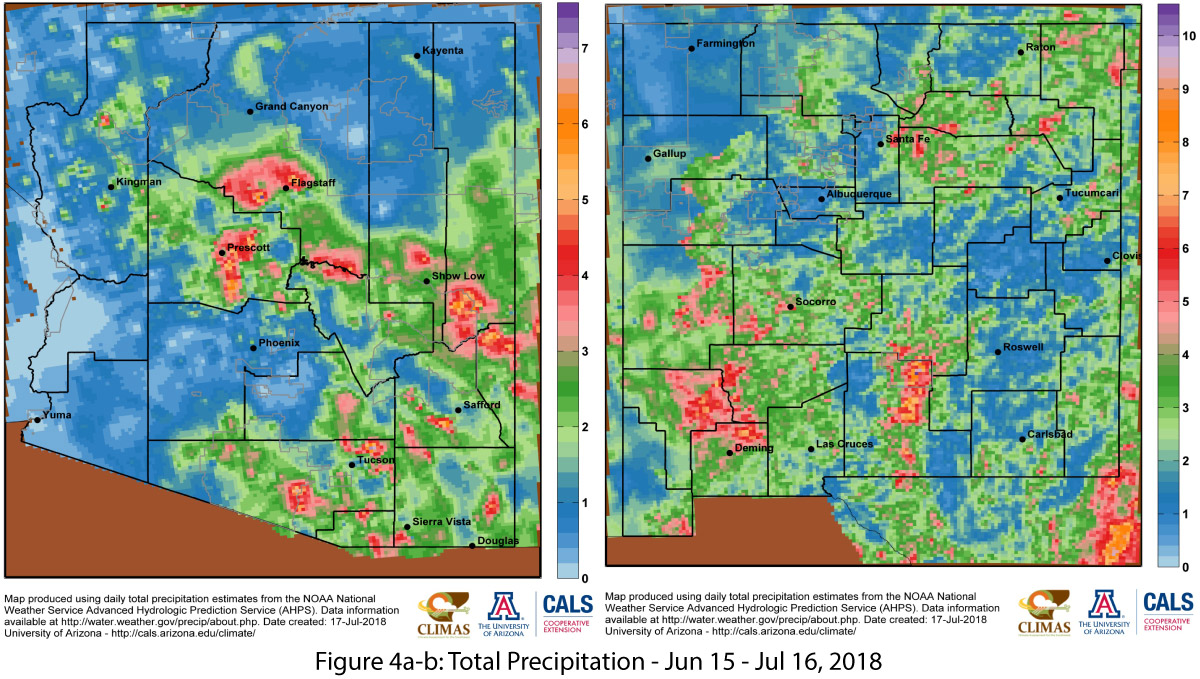
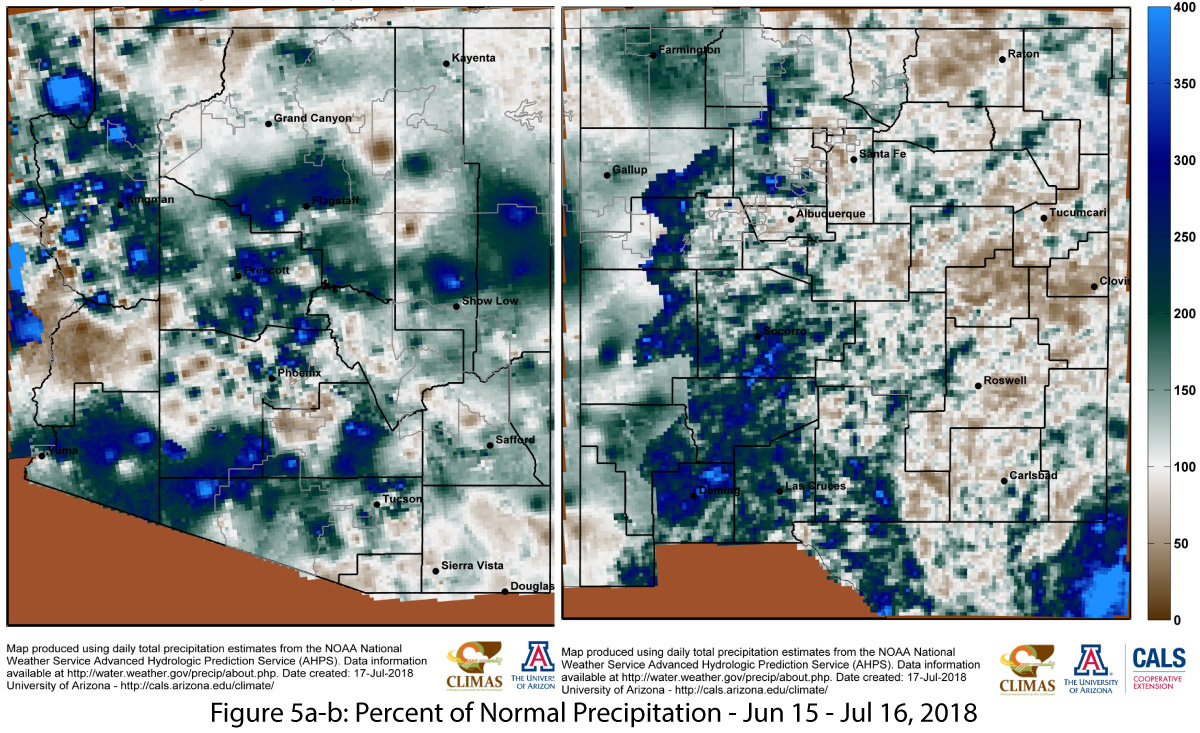
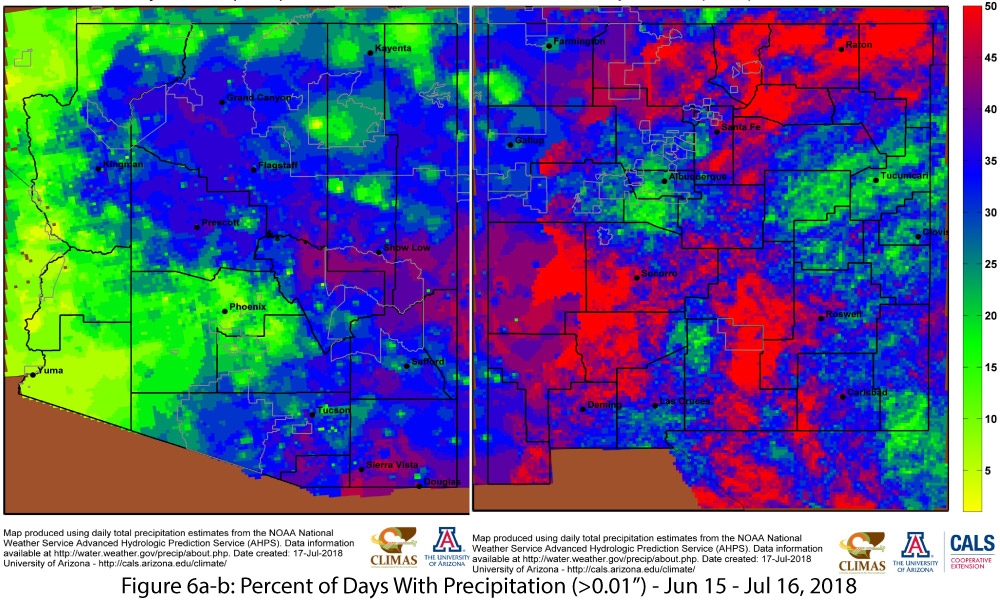
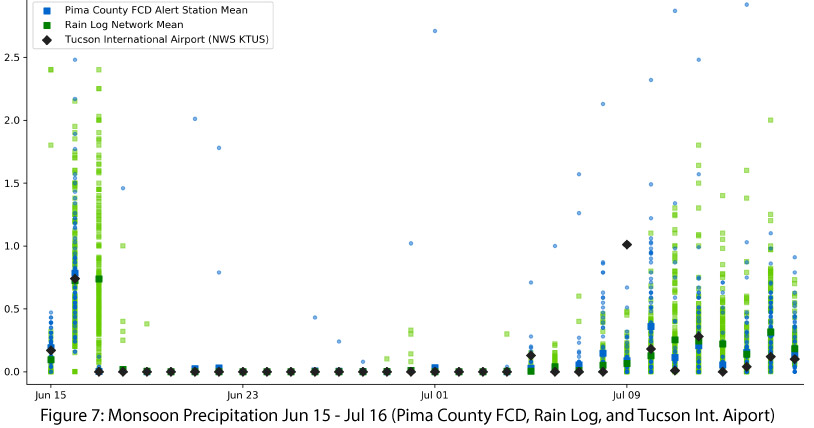
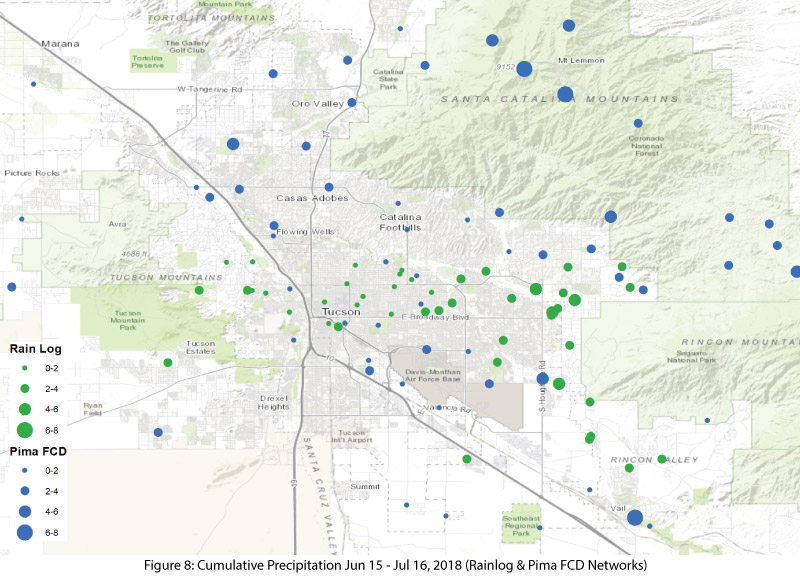
Within the Tucson metropolitan region, an initial surge of activity associated with the remnants of Hurricane Bud brought considerable rainfall to the region June 15-17 (see last month’s Outlook for details). For much of the rest of June and the first week of July, however, there were few storms. Around July 8, rainfall picked up with widespread activity on a nearly daily basis, but with a wide range of daily totals from site to site (Fig. 7). Cumulative totals for the first month of the monsoon further reveal the extent to which some areas have received frequent and/or abundant precipitation, while others locations–often relatively nearby–have not (Fig. 8).
Online Resources
- Figure 1 - International Research Institute for Climate and Society - journals.ametsoc.org/doi/abs/10.1175/2007JCLI1762.1
- Figures 2-3 - CLIMAS: Climate Assessment for the Southwest - climas.arizona.edu
- Figures 4-6 - UA Climate Science Application Program - cals.arizona.edu/climate
- Figures 7-8 - CLIMAS: Climate Assessment for the Southwest - climas.arizona.edu Data: RainLog.org & Pima County Flood Control District