June 2018 SW Climate Outlook - Monsoon Tracker & Tropical Storm Bud
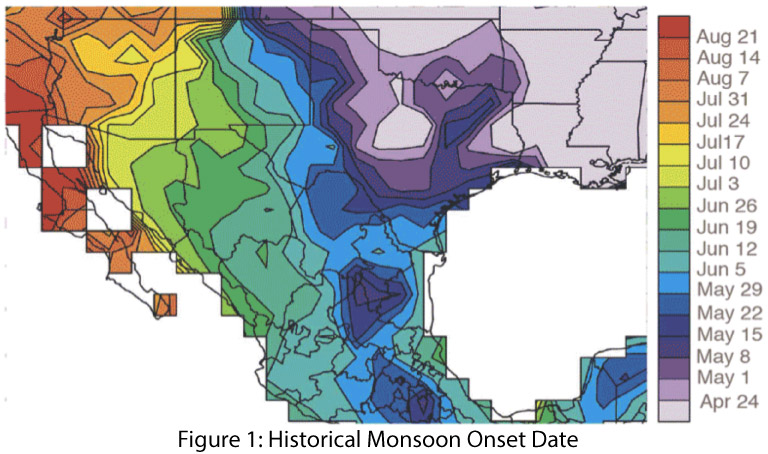
Was our mid-June precipitation the monsoon? In 2008, the National Weather Service (NWS) changed the definition of the start of the Southwest monsoon from a variable date based on locally measured conditions to a fixed date of June 15 (and a fixed end date of Sept 30). This allowed for a clear delineation of the period of monsoon activity (108 days) and focused NWS’s messaging strategy as it pertains to the expected hazards during that period, which include extreme heat, strong winds, dust storms, flash flooding, lightning, and wildfires (see NWS Tucson monsoon information hub). Prior to 2008, the flexible start date reflected the seasonal progression of the monsoon, with a considerable temporal gradient across the region (Fig. 1).
This gradient is linked to seasonal atmospheric patterns and the establishment of the “monsoon ridge” in the Southwest (Figs. 3a-b, also see sidebar for link to NWS pages). The heating of the complex topography of the western U.S. with the increasing sun angle and contrast with the cooler water of the adjacent Pacific Ocean lead to the establishment of this upper-level ridge of high pressure over the Southwest U.S. (also known as Four Corners High). The flow around this upper-level ridge shifts from a dry southwesterly fetch in May to a moisture-rich southerly-southeasterly fetch in late June/early July (see figure below).


In Southern Arizona, the monsoon start date was based on the average daily dewpoint temperature. Phoenix and Tucson NWS offices used the criteria of three consecutive days of daily average dewpoint temperature above a threshold (55 degrees in Phoenix, 54 degrees in Tucson) to define the start date of the monsoon. As shown in Figure 3 the dewpoint temperature criterion produced start dates ranging from mid-June to late July over the period of record (1949-2016).

Notably, by this metric, the earliest start date on record was June 17, but early July is far more common. In any case, June precipitation is relatively rare in southern Arizona (Fig. 4), thus the recent incursion of moisture from Tropical Storm Bud was a welcome change to our typical mid-June dry heat. Arriving in southern Arizona precisely on June 15 – the now official start of the monsoon – Bud raised the question: Did this moisture qualify as “monsoon”?

The moisture from Tropical Storm Bud was key to the widespread event, but the rain also was dependent on a low-pressure system that happened to be nearby. Bud was caught between a trough of low pressure off the coast of California and the subtropical ridge which was displaced well to the east over the Gulf of Mexico. The flow pattern over this event resembled a “transition” pattern typically seen at the end of the monsoon season (Fig. 5), when the mid-latitude jet stream becomes more active and the monsoon ridge starts to retreat south. Together these features helped guide the storm into southern Arizona.

The approaching trough of low pressure was also critical to cooling upper-level air temperatures, increasing the instability of the very moist airmass at the surface, and providing wind shear to help organize any storms that formed. This kind of assist is possible at the beginning of the monsoon in June but is much more common in late summer when we are transitioning out of the monsoon. It rarely occurs in the middle of the monsoon because of the dominance of the subtropical ridge pattern that limits how close mid-latitude storms can get to the Southwest. Ultimately, the storm was less dependent on the exact track that Bud took in mid-June (Fig. 6), and more dependent on the coalescence of larger atmospheric patterns that came together to bring welcome – if unexpected – precipitation to the Southwest.

The following images are examples of different data visualizations of this regional variability.


Online/Image Resources
- Figure 1 - International Research Institute for Climate and Society - journals.ametsoc.org/doi/abs/10.1175/2007JCLI1762.1
- Figures 2a-2b - Monsoon Definition & Progression - National Weather Service - Tucson - wrh.noaa.gov/twc/monsoon/monsoon.php
- Figure 3 - CLIMAS: Climate Assessment for the Southwest - climas.arizona.edu
- Figure 4 - CLIMAS: Climate Assessment for the Southwest - climas.arizona.edu
- Figure 5 - National Weather Service Tucson - wrh.noaa.gov/twc/monsoon/monsoon.php
- Figure 6 - National Hurricane Center - nhc.noaa.gov
- Figure 7 - UA Climate Science Application Program - cals.arizona.edu/climate
- Figure 8 - Rainlog Citizen Science Monitoring Program - rainlog.org
- Figure 9 - CLIMAS: Climate Assessment for the Southwest - climas.arizona.edu