April 2018 SW Climate Outlook - Cool Season Precip Summary (Oct - Mar)
From the April issue of the CLIMAS Southwest Climate Outlook
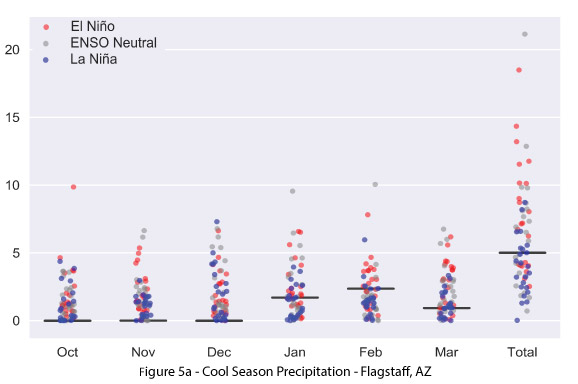
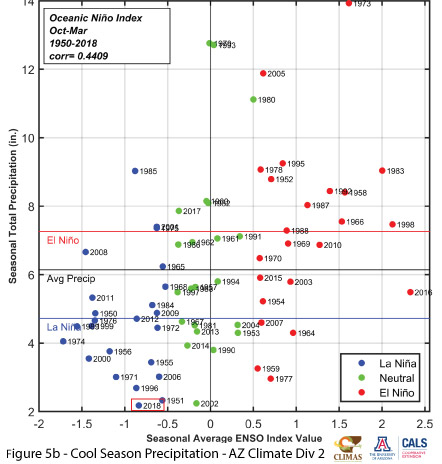
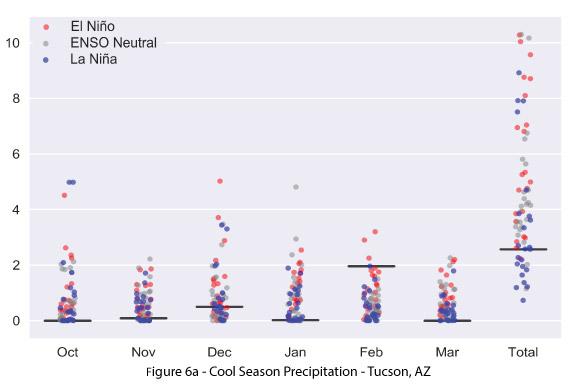
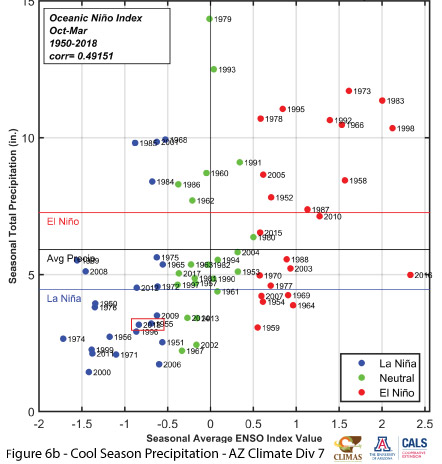
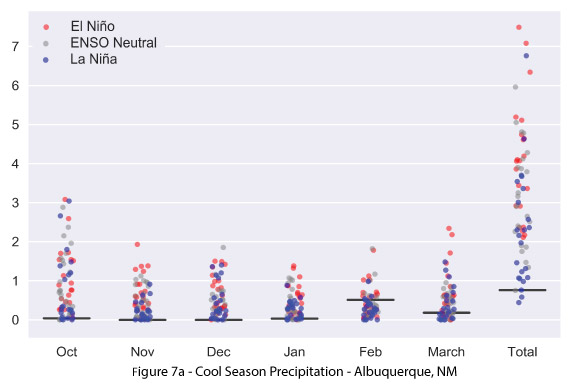
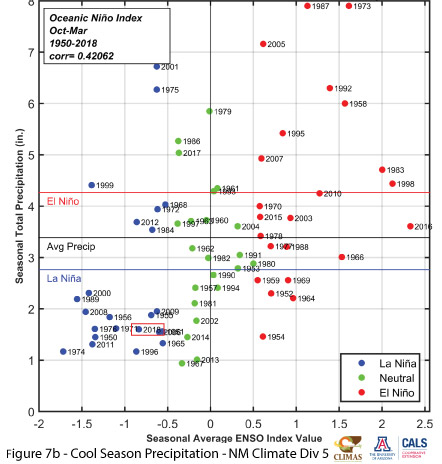
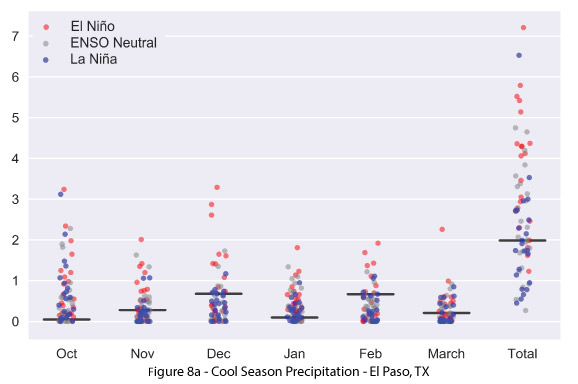
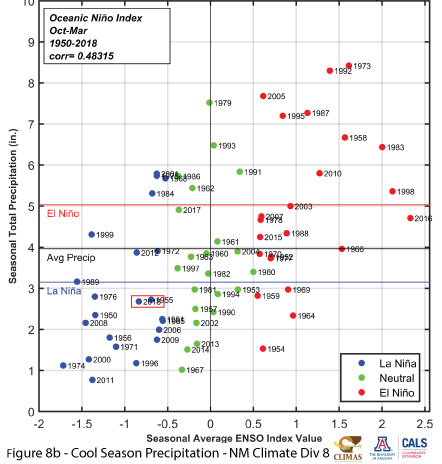
Monthly and cool-season (Oct-Mar) precipitation totals demonstrate how this La Niña year compares to previous years, and helps characterize the influence of ENSO on cool-season precipitation. Figures 5a-8a describe monthly and cool season precipitation totals at four weather stations (Flagstaff, AZ; Tucson, AZ, Albuquerque, NM, and El Paso, TX), where each dot corresponds to observed monthly and cool-season precipitation for each year since 1950, color coded by the ENSO status of that year, and the horizontal black lines correspond to 2017-2018 precipitation. Figures 5b-8b are scatterplots of ENSO index vs. precipitation totals for the regional climate division that contains each weather station.
A closer look at individual stations highlights some notable observations. Flagstaff recorded almost no precipitation from October through December, and the corresponding climate division recorded record-dry conditions for the entire October-through-March period. In Tucson, nearly all of the October-through-March precipitation fell over just a few days, and the plot illustrates the role that those few storms played in boosting seasonal totals. Albuquerque had a run of months with near-zero precipitation broken by a few storms in February that boosted the station from record-dry to merely top-five driest, while the regional climate division was just below average. El Paso fared better than many regional stations, but still recorded generally below-average precipitation.