SW Climate Outlook - Monsoon Tracker - July 2017
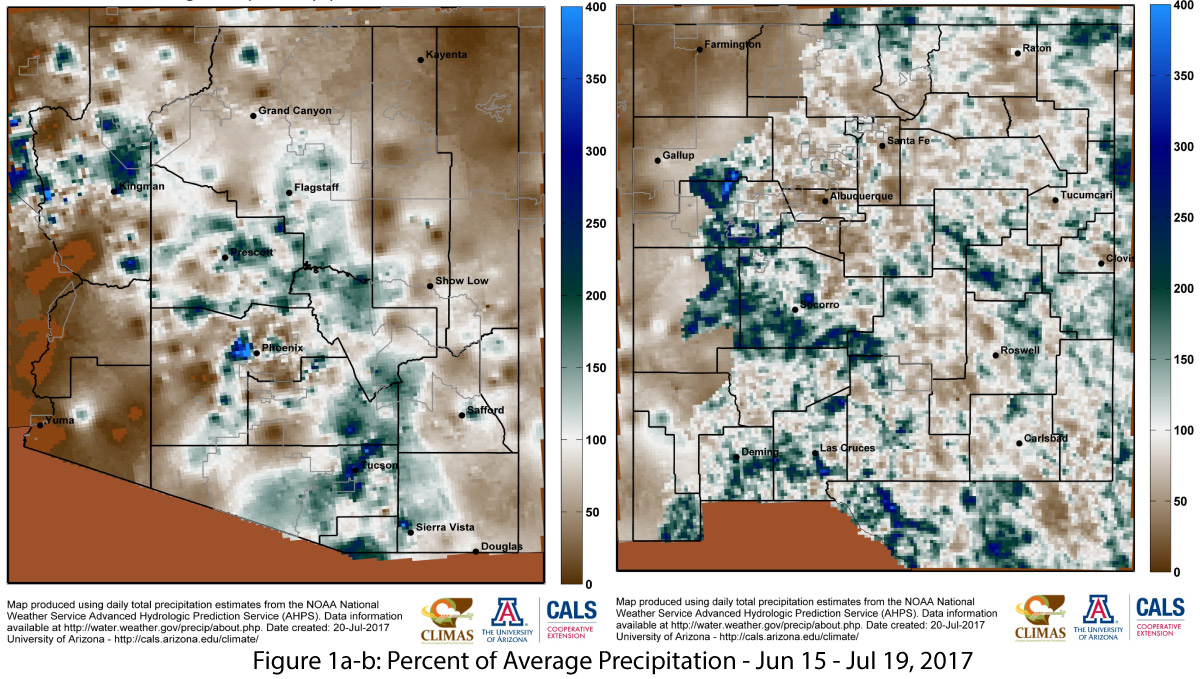
The official start date of the monsoon (June 15) was overshadowed by a Southwest-wide extreme heatwave that set numerous records. Heatwaves in June are a typical feature of the seasonal climate, especially as the subtropical ridge builds north, but these record temperatures also increased the anticipation for the relief that the monsoon can provide. Much of southern and central Arizona have recorded pockets of above-average precipitation, while New Mexico has seen more widely distributed precipitation since June 15 (Fig. 1a-b). The maps highlight the extreme spatial variability of monsoon precipitation and the difficulty of scoring or grading the monsoon performance using single stations or summary maps (not that we don’t continue to try!). Another useful metric is the percent of days with rain, which, when used with the precipitation maps, distinguishes areas that have received more frequent and moderate precipitation from those in which just a few extreme events boosted seasonal totals. In Arizona, the southeastern corner and a swath across the higher-elevation areas of the central part of the state have received the most consistent precipitation, with significant variability across other areas (Fig. 2a). In contrast, precipitation frequency is relatively uniform across most of New Mexico, reflecting an earlier start to the monsoon as well as more overall precipitation activity (Fig. 2b).