Mar 2017 SWCO - La Niña Recap
 This event began in fall 2016, ended in early February 2017, and throughout the period oceanic and atmospheric indicators generally hovered near the boundary between weak La Niña and ENSO-neutral conditions. According to CPC criteria, this was a weak La Niña event (but just barely); other agencies use slightly different criteria (see last month's ENSO tracker for details), highlighting the difficulty in categorizing these borderline events. This weak strength also affects how precipitation and temperature patterns are interpreted. In the Southwest, a La Niña event is more likely than not to bring warmer- and drier-than-average conditions over the cool season, but a weak La Niña event might not even stand out from the normal seasonal variation of typically dry southwestern winters (Fig. 5).
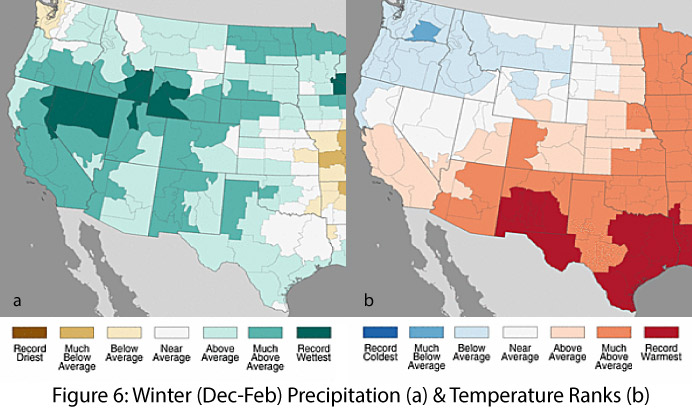
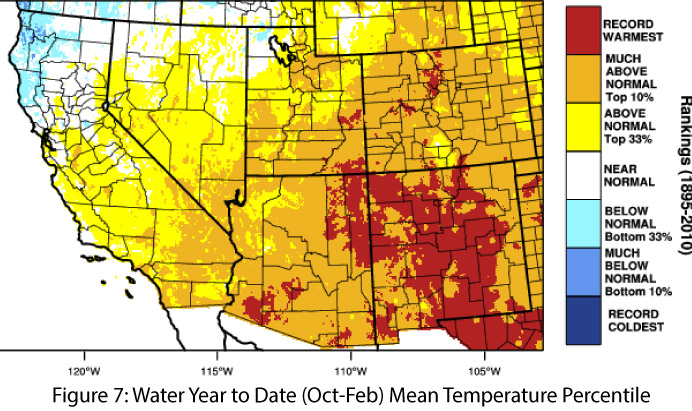
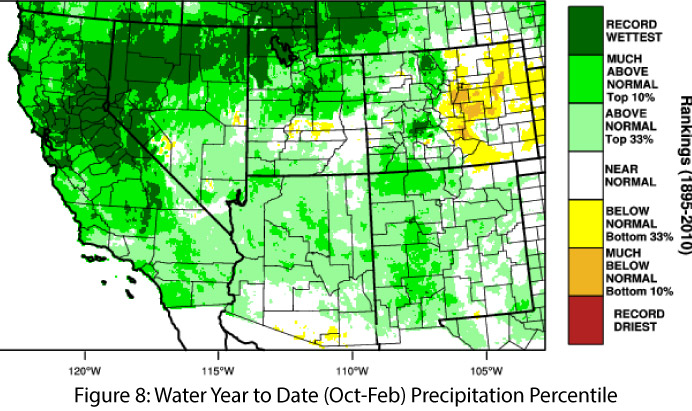
So how did this La Niña event stack up compared to expectations? If last year’s El Niño was an underperformer in terms of producing above-average precipitation, then this year’s La Niña was a welcome deviation from precipitation expectations. Winter (DJF) precipitation was above average to much-above average across most of the West (Fig. 6a)—not the typical pattern associated with La Niña, but perhaps a reminder of just how “borderline” this La Niña event really was. Winter (DJF) temperatures generally matched the expected pattern of warmer than average in a La Niña year (Fig. 6b), although separating out the ENSO influence from general trends and record-warm global temperatures is difficult. The cool season (Oct-May) is not yet over, but the water year temperatures and precipitation values to date (Figs 7-8) generally mirrored the winter (DJF) pattern, save for a pocket of below-average precipitation along the Arizona borderlands region.
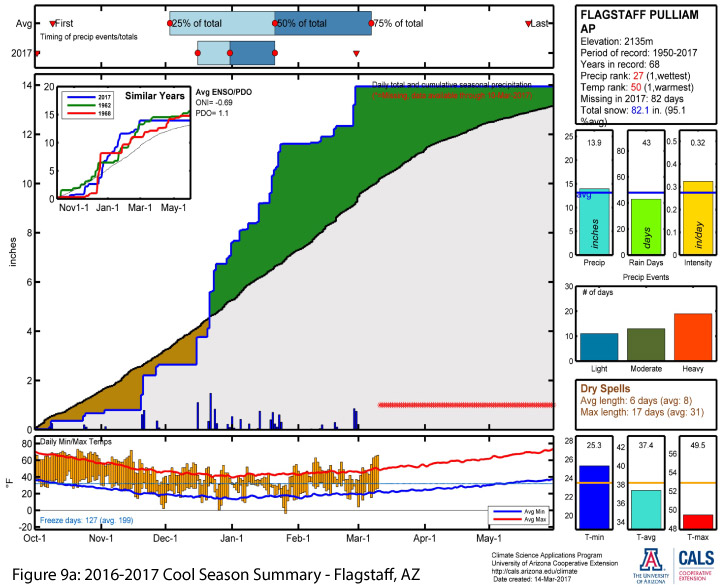
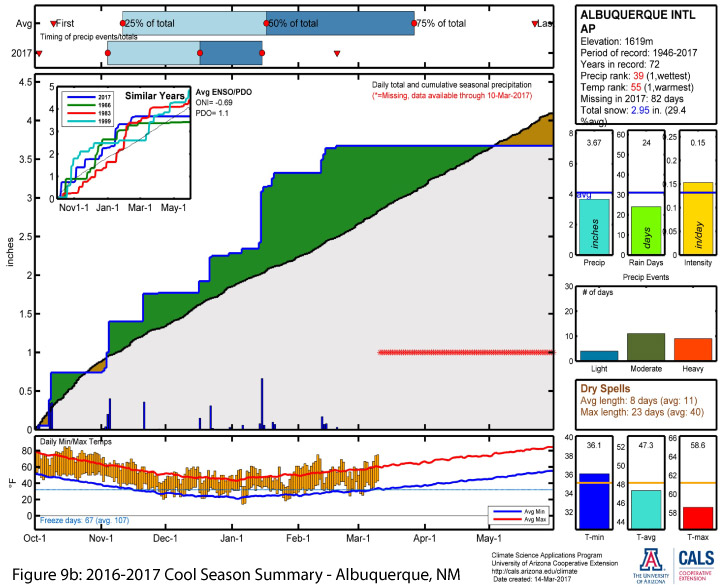
Looking to specific weather stations across the region, we see a similar pattern: most of the stations are recording above-average cool-season precipitation totals to date (Figs. 9a-b, 9d), aside from those in southern Arizona (Fig. 9c, 9e). Seasonal totals are not the entire story, and looking at the number of days with rain and dry spells (lower right corner of graphics) is another set of metrics that helps characterize the season. Many of the weather station plots reveal numerous lower-intensity precipitation events and a relatively greater number of days with rain, with correspondingly fewer and shorter dry spells (Figs. 9a-d) while fewer stations saw a smaller number of high-intensity events make up most of their seasonal precipitation total (Fig. 9e). Steady and soaking rains and higher-elevation snowfall are an important part of drought recovery, as more moisture is stored or banked in the system (as snowpack, soil moisture, etc.) and less is lost to runoff and evaporation.
In addition to cumulative seasonal totals and the number of days with rain over the season, precipitation must also be evaluated against the effects of elevated temperatures, which can reduce snowpack and water storage over winter and alter the timing of streamflow during spring and summer. Thus, there were concerns in the run-up to this La Niña event that its typical warmer temperatures and reduced precipitation would exacerbate existing drought conditions. Fortunately, La Niña’s drier tendencies have not come to pass, and current snowpack, streamflow forecasts, and water resource management projections are generally optimistic (Fig. 10), offering hope that this pattern will last through spring and that elevated temperatures do not substantially affect snowpack or the timing of streamflow.
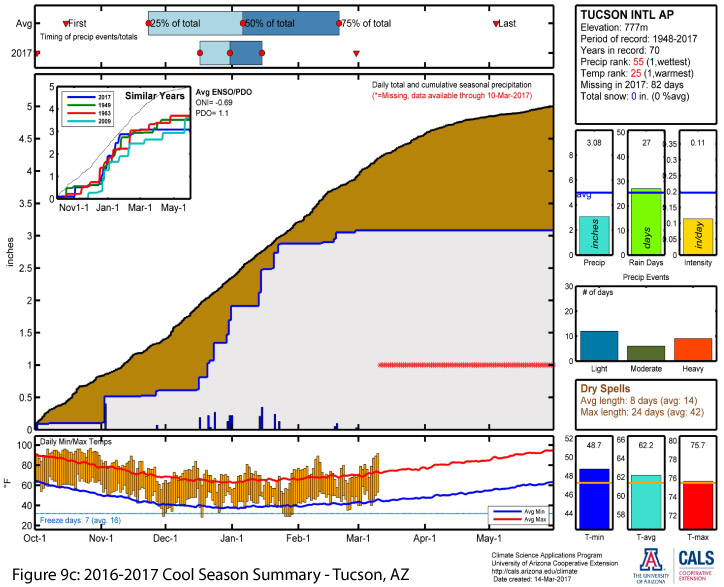
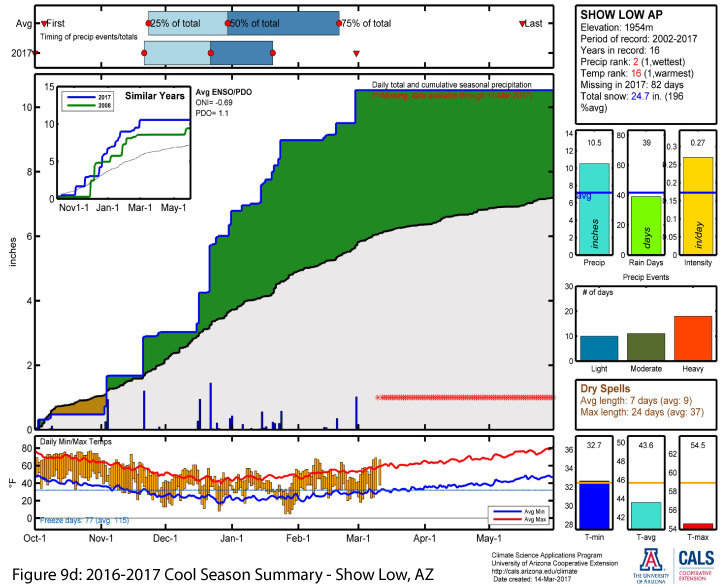
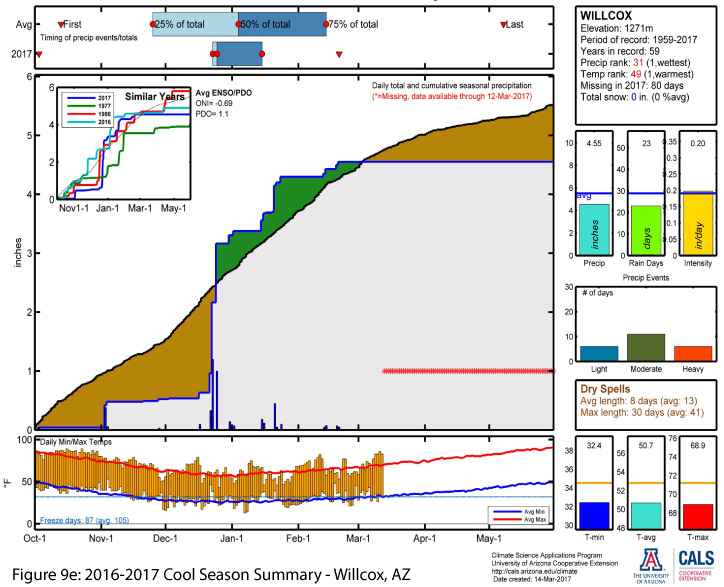
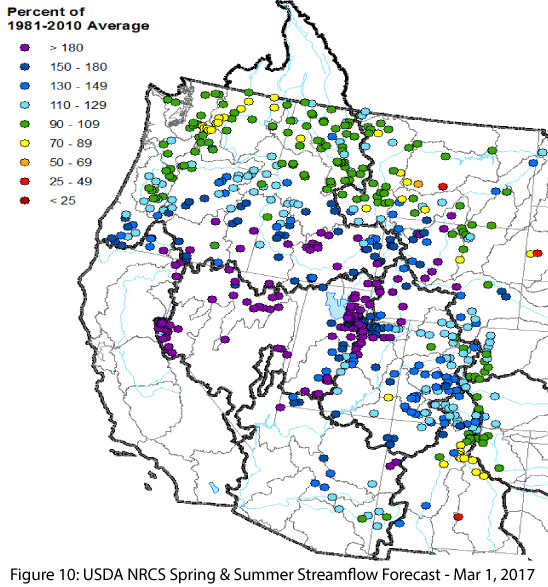
Image Sources:
- Figure 5 - Climate Science Applications Program
- Figure 6 - National Center for Environmental Information
- Figures 7-8 - Western Regional Climate Center
- Figures 9a-9e - UA Climate Science Applications Program
- Figure 10 - Natural Resources Conservation Service
- NOAA - Climate Prediction Center - El Niño Criteria and Oceanic Niño Index Values