2016 Water Year in Review
From the November issue of the CLIMAS Southwest Climate Outlook
Water year precipitation (October 1, 2015 to September 30, 2016) was below average in much of the Southwest, particularly in Southern California, most of southern Arizona, and western New Mexico, and average to above average in northern Arizona and eastern New Mexico (Fig. 1). Spatial representations of cumulative water year precipitation adequately characterize the overall distribution of above- and below-average precipitation totals, but they do little to document the month-by-month accumulation of precipitation. This can be important, as heavy precipitation events such as tropical storm activity or monsoon events can quickly boost yearly totals, but with a lesser contribution to long-term water storage (as water from extreme events is lost to evaporation and runoff).

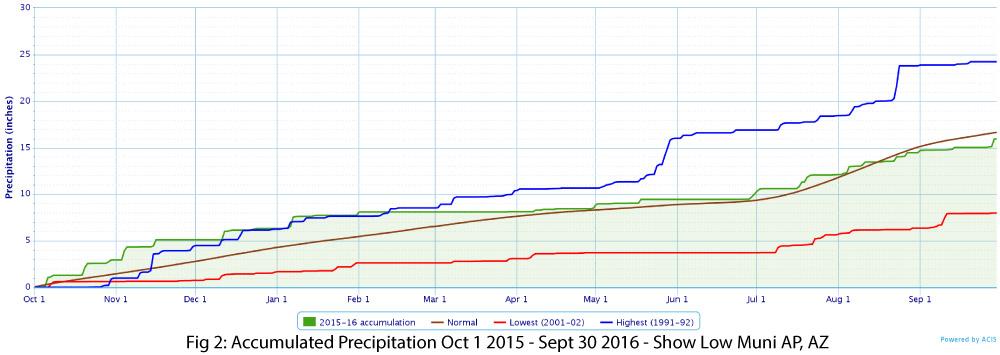
The Show Low Municipal Airport weather station (Fig. 2) is an example in which the monthly accumulation (green) stuck rather closely to the normal accumulation, with a number of winter storms bringing the cool-season total very close to average by May 1, and then typical monsoon events bringing the seasonal cumulative total very close—albeit just shy—of the expected normal. A few of the stations that recorded above-normal cumulative totals reveal other patterns. The Flagstaff Pulliam station (Fig. 3) recorded very close to normal cool-season precipitation (October 1 to May 1), but above-normal monsoon activity helped push the seasonal total above average. The Las Cruces (NMSU) weather station (Fig. 4) recorded a fairly normal monsoon and numerous events that brought above-average conditions over the cool season, resulting in above-average seasonal totals. The El Paso International Airport station (Fig. 5) recorded both above-average cool-season and monsoon precipitation. Of those stations that recorded below-average precipitation, some saw relatively normal cool-season precipitation but below-average monsoon precipitation (Fig. 6). Other stations recorded relatively typical monsoon precipitation but were starting at a deficit coming out of the cool season (Fig. 7).
So what’s the point? Water year precipitation is just one of the metrics we use to assess drought and water supply. As has been discussed at length, a week of heavy monsoon activity or a direct hit from a tropical storm, while they tend to boost seasonal and water year totals, may do less to help with long-term drought than we would hope. Looking back at El Niño and the winter of 2015–2016, this is one of the reasons why so much hope was pinned on that event, and why so much disappointment resulted when it performed so poorly in the Southwest. Sustained and soaking winter preciptiation that builds snowpack at higher elevations while it soaks into the ground in the lower elevation deserts and rangeland is one of the more effective ways the region might start to bounce back from sustained multi-year droughts. Looking forward to winter 2016-2017, the seasonal outlooks show the influence of La Niña conditions, (i.e. warmer- and drier-than-average conditions over winter), suggesting decreased chances of winter preciptation events that are crucial to the region in terms of drought and water resources managment.


Other Resources
- USGS Arizona Water Science Center - http://az.water.usgs.gov/
- USGS New Mexico Water Science Center - http://nm.water.usgs.gov/
- Univ. of Arizona Water Resources Research Center - https://wrrc.arizona.edu/
- New Mexico Water Resources Research Institute - https://nmwrri.nmsu.edu/
- Arizona Dept of Water Resources - http://www.azwater.gov/azdwr/
- New Mexico Office of the State Engineer - http://www.ose.state.nm.us/WR/