El Niño is here…what exactly does that mean for Arizona and New Mexico?
“El Niño” has been all over the news lately, even garnering comparisons to a Godzilla – a prehistoric sea monster awakened and empowered by nuclear radiation (thank you Wikipedia). This characterization is in response to the near record strength of this El Niño event, which is exciting for climate enthusiasts, but leaves most people wondering; what does a strong El Niño event actually mean for Arizona and New Mexico? Are we talking floods? Droughts? Plagues of locusts? Additionally, how soon can we expect this “El Niño” character to show up? In other words, what does a realistic assessment look like?
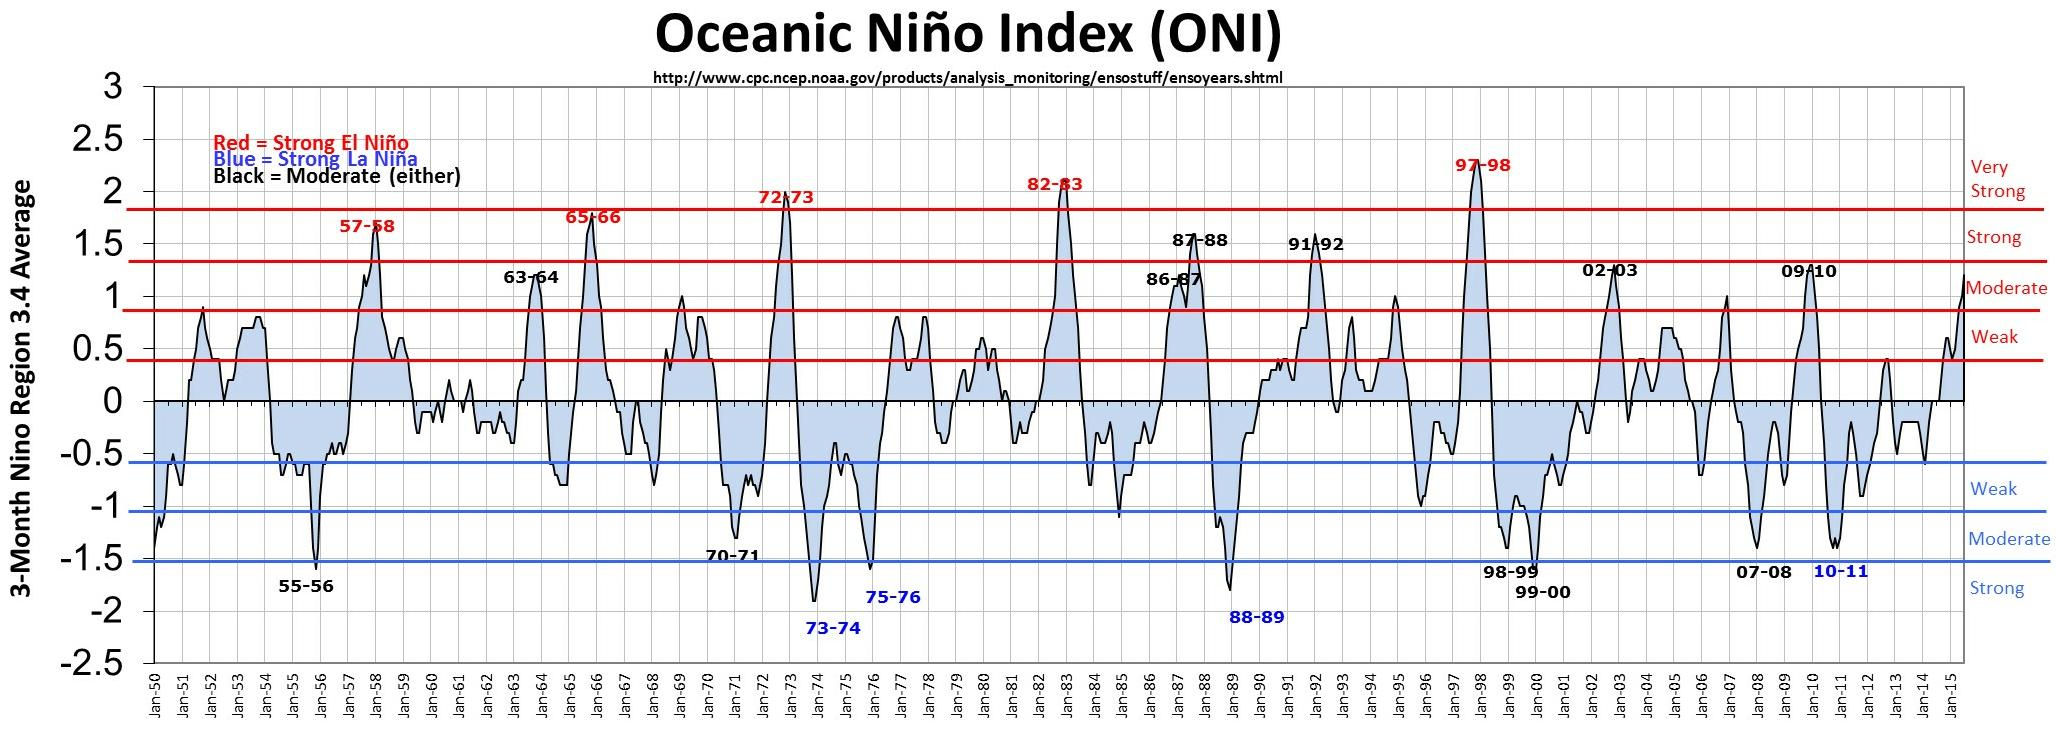
First of all, El Niño is not a singular weather event that will storm ashore on a particular date. Climate.gov has come up with an excellent analogy – tying the effects of El Niño to a big construction project - you will definitely feel the effects, but these vary with space and time and are dependent on a number of factors. There are a number of El Niño primers (e.g. the climate.gov ENSO blog) that explain how El Niño works in technical terms, but to put it simply, El Niño is part of the El Niño-Southern Oscillation (ENSO) which is a semi-regular shift on the order of several years (Figure 1, Oceanic Niño Index) in sea surface temperatures, atmospheric pressure, and rainfall patterns, along the equator in the Pacific Ocean. These shifts (between El Niño and La Niña event) reorganize global weather patterns that can drive drought and flood patterns on a regional basis.
Our understanding of the global impact of El Niño events has improved considerably over the last few decades. In particular, we can often detect the development of an El Niño event months in advance, long before it will ever have an impact on seasonal weather conditions. For Arizona and New Mexico, an El Niño event means increased probability of receiving above-average winter precipitation, generally between October and March. However, there is still plenty of variability when comparing El Niño events, and there is no guarantee that any given El Niño event will lead to wetter than average conditions.
In order to look more closely at this relationship, it helps to take a look at plots describing the relationship between past El Niño and La Niña events, and October-March total precipitation for select regions in Arizona and New Mexico.[1] A couple key points:
-
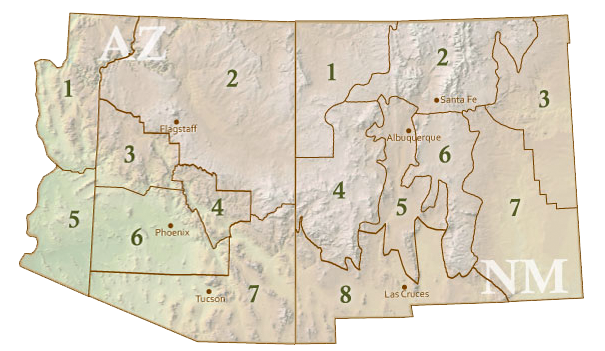 We will be looking at precipitation totals within climate divisions, which represent average values over large multi-county areas (Figure 2, AZ & NM Climate Divisions). These totals are calculated using station observations within these regions.
 -
We will be using a simple metric called the Oceanic Nino Index (ONI) to assess the phase and strength of ENSO. The ONI describes temperature anomalies (warm or cool) in the central and eastern Pacific Ocean along the equator, which in turn relates to shifts in tropical thunderstorm activity and resultant impacts to global atmospheric circulation.
Figures 3a & 3b compare the ENSO-precipitation relationship for two regions in Arizona (climate division 3 and climate division 7). Total cool-season precipitation is on the y axis, and the average ONI value for the same Oct-March period is on the x axis. The dots are color coded: red to reflect El Niño events (ONI values > 0.5), blue for La Niña events (ONI values < -0.5), and green for ENSO neutral years (ONI between -0.5 and 0.5).. At first glance, the blue dots (La Niña years) are clustered much lower on the y-axis, while the red dots (El Niño years) are much higher on this axis. This characterizes the historical connection between La Niña events and dry winters, while El Niño years are associated with wet winters. The horizontal lines on the plots are the average cool-season precipitation for all years (black line), La Niña years (blue line), and El Niño years (red line), and help illustrate this relationship further.
The more you stare at this graph (trust me, we’ve done our share of staring!), the more you see that this relationship is complicated, and even varies between the two regions in Arizona. In general there is a relationship between the ONI index value and the amount of cool-season precipitation (see correlation values on each figure), but this relationship is noisy at best, and demonstrates that the strength of the ENSO phase (in this case using ONI) isn’t a perfect linear fit with total cool season precipitation. Some of the biggest outliers are linked to weak or even moderate strength El Niño events, but are associated with below average winter precipitation (We're looking at you, 2007). This is especially evident as you move north in the region (see climate division #3), where the relationship between El Niño strength and cool season precipitation is even weaker. What’s the point of all this? El Niño is not a slam dunk forecast for unusually wet cool season conditions for the Southwest.
But…this year we are in rare territory with respect to the current and forecasted strength of this El Niño event. Current forecast models indicate that ONI values should reach approximately 2 deg C (above normal) over the upcoming winter season, making it one of the strongest El Niño events on record and on par with past big events like 1982-83 and 1997-98. When we look for these years on the plots in figure 2, we see that both of these years were associated with above-average precipitation. In fact, the three “strong” events (1973, 1983, 1998) and the as well as the five “moderate” years (1958, 1966, 1987, 1992, 2010) all saw above average precipitation, which means that as long as this event stays strong (all indications are that it will) we will likely see a wetter than average winter. A large caveat being the sample size of this relationship is VERY small.
 This pattern is even stronger for climate division 7 (southern Arizona) where the overall relationship between ONI and cool season precipitation is stronger. This is consistent with observations that the relationship between ENSO and winter precipitation is stronger over southern parts of Arizona (Figure 4, Percent of normal winter precipitation 1983 & 1998) and New Mexico. This can be attributed to a stronger than average and more persistent sub-tropical jet stream that favors southern Arizona and New Mexico with above-average winter storm activity.
The current seasonal precipitation forecasts for the upcoming winter season issued by the NOAA Climate Prediction Center also reflect this expectation for additional moisture, especially in the SW. The best chances for observing above-average winter precipitation cover all of Arizona and New Mexico, but are slightly better for the southern half of each state. There is a pretty good chance that the next red dot for this upcoming year that shows up on these plots will be above-average for most climate divisions across the Southwest, but how much above-average will be very interesting to see.
[1] We are borrowing this idea from the Western Regional Climate Center.