Monsoon Summary Jun 15-Aug 20
Originally published in the August 2015 CLIMAS Southwest Climate Outlook
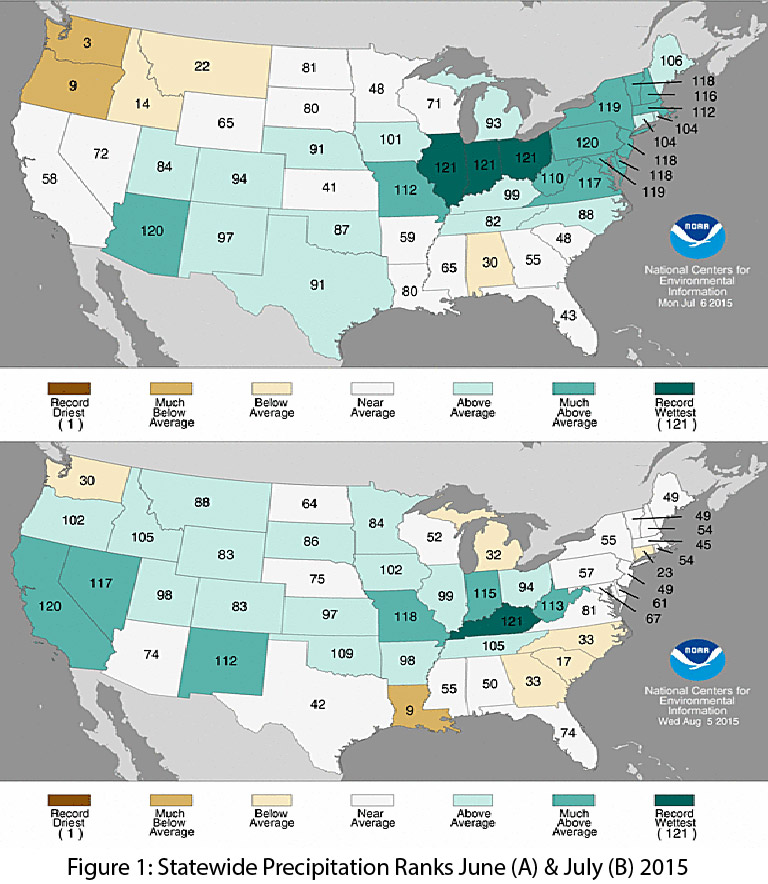
The monsoon started off early and strong with several widespread thunderstorms in late June and early July, especially in Arizona, which recorded its second wettest June on record. Precipitation tapered to some extent in July in Arizona but continued to be frequent and widespread in New Mexico, which recorded its 10th wettest July on record (Figs. 1a-2a).
Overall monsoon activity has taken a break thus far in August, although a few powerful and localized storms brought significant precipitation to portions of Arizona. This pattern is a defining characteristic of the 2015 monsoon, particularly in Arizona, where many of the monsoon storms have been highly localized, dropping heavy precipitation in smaller areas and often on high elevation peaks instead of more widespread and systematic monsoon activity. Portions of southern Arizona and the Four Corners region—areas that saw considerable precipitation deficits in the past few years—have been the beneficiaries of this variable coverage, especially in the past few weeks. This pattern may change if the monsoon ridge sets up further east, allowing for more organized storm activity to flow in from the south in the coming weeks, or if later-season eastern Pacific tropical storm activity ramps up and helps drive moisture into the region.
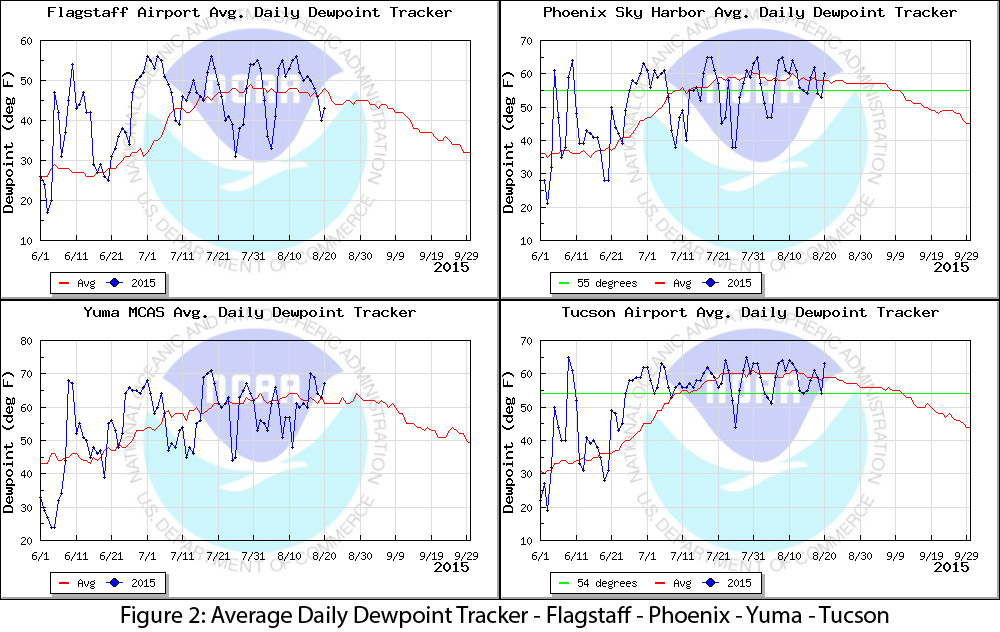
We also have seen some weakening of the monsoon ridge since July 5, likely due to El Niño convection picking back up, but it remains to be seen what the overall impact of El Niño will be on this year’s monsoon. Regional dewpoint readings also illustrate the variability of monsoon activity, particularly in July and into August (Fig. 2).
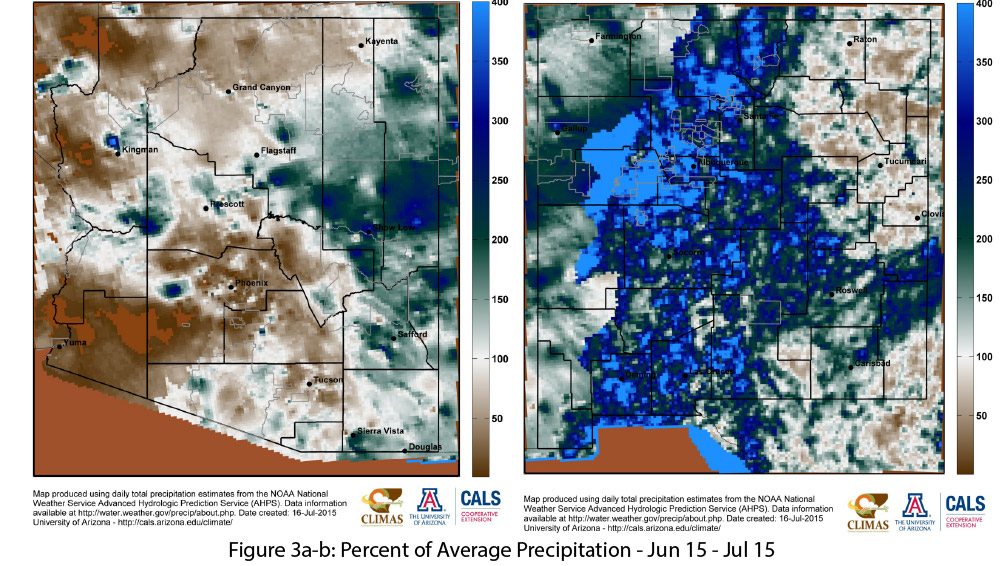
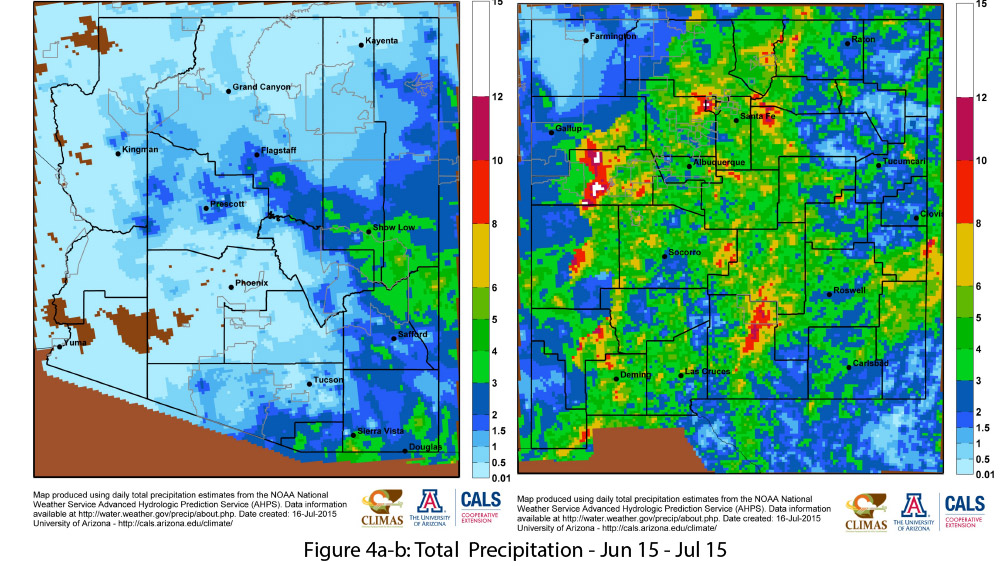
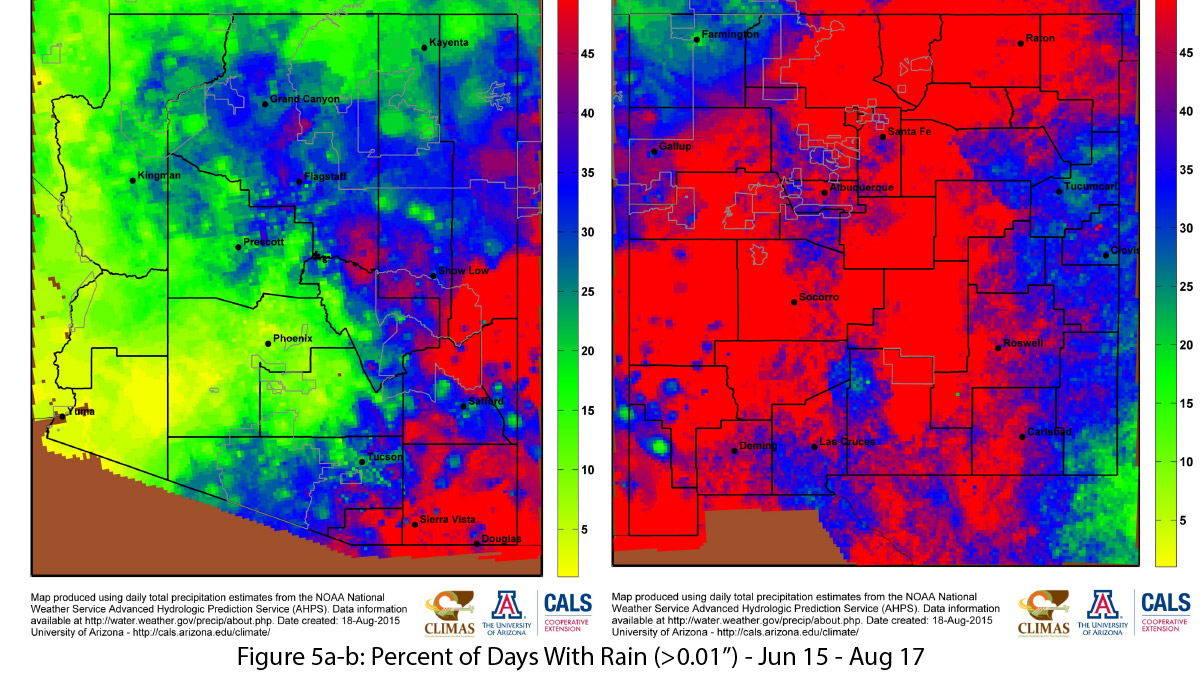
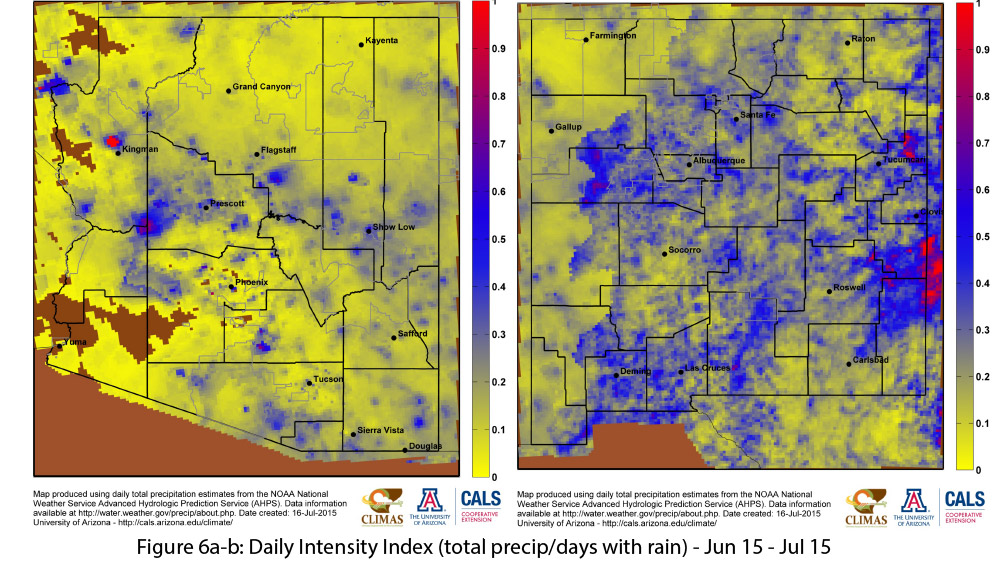
In the first two months of the monsoon, most of northern Arizona and nearly all of New Mexico recorded above-average precipitation (Figs. 3a–b), albeit with a wide range of precipitation totals across the region (Figs. 4a–b). Southwestern Arizona, particularly the southwest and northwest corners, are notable exceptions to this pattern, although these areas typically receive far less monsoon precipitation overall. The percent of days with rain highlights the regularity of monsoon precipitation thus far, with much of eastern Arizona and nearly all of New Mexico recording rain events (greater than 0.01 inch) on 35 to 50 percent of days since June 15 (Figs. 5a–b). The daily intensity index (Figs. 6a–b) further illustrates the steady nature of most of this monsoon precipitation; higher values indicate much of the rain fell in a single event and lower values indicate more frequent and less intense events.