Monsoon Summary - (June 15 - July 16)
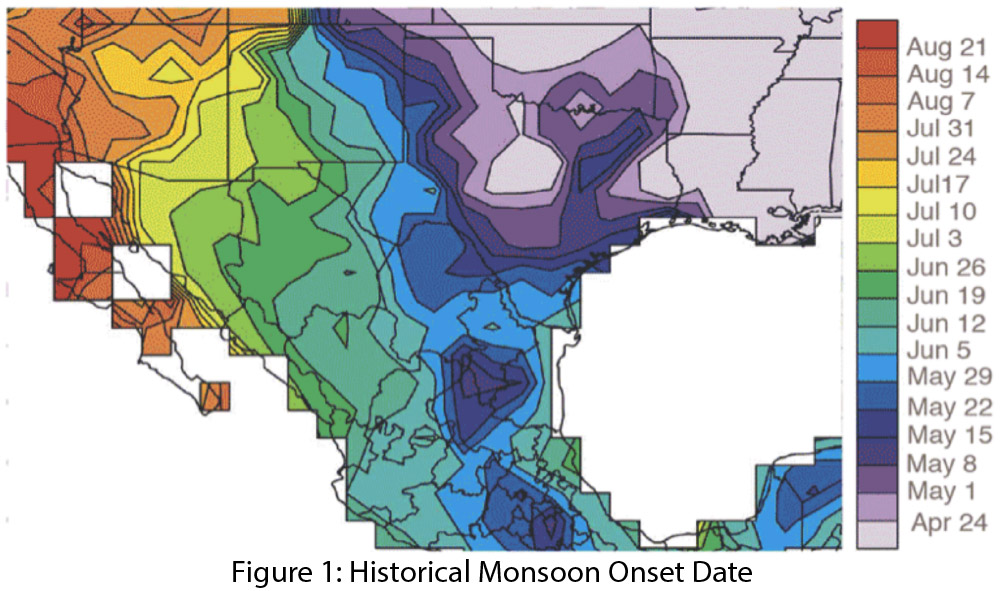
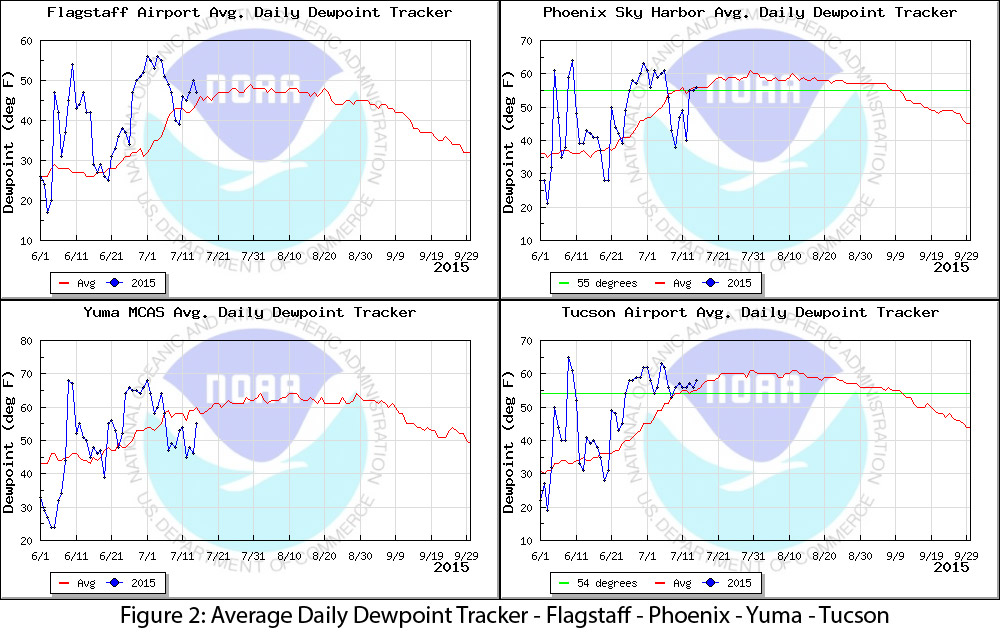
After a few anomalous incursions of tropical moisture in early June, we saw an early beginning to the monsoon in mid- to late June, a few weeks ahead of the typical start date (Fig. 1). Regional dewpoint/humidity readings for June illustrate the multiple incursions of tropical moisture, followed by the onset of monsoon conditions later in the month (Fig. 2).
The monsoon ridge was able to set up early, leading to a number of precipitation events (including above-average precipitation) across the Southwest starting in the last week of June. As recently as last month, we had been anticipating a delayed start to the monsoon, as El Niño conditions tend to suppress its onset. However, the opposite occurred, possibly due to a record-strong Madden Julian Oscillation (MJO) pattern that temporarily suppressed El Niño’s typical influence on the subtropical ridge. We have seen some weakening of the monsoon ridge since July 5, likely due to El Niño convection picking back up, but it remains to be seen what the overall impact of El Niño will be on this year’s monsoon.
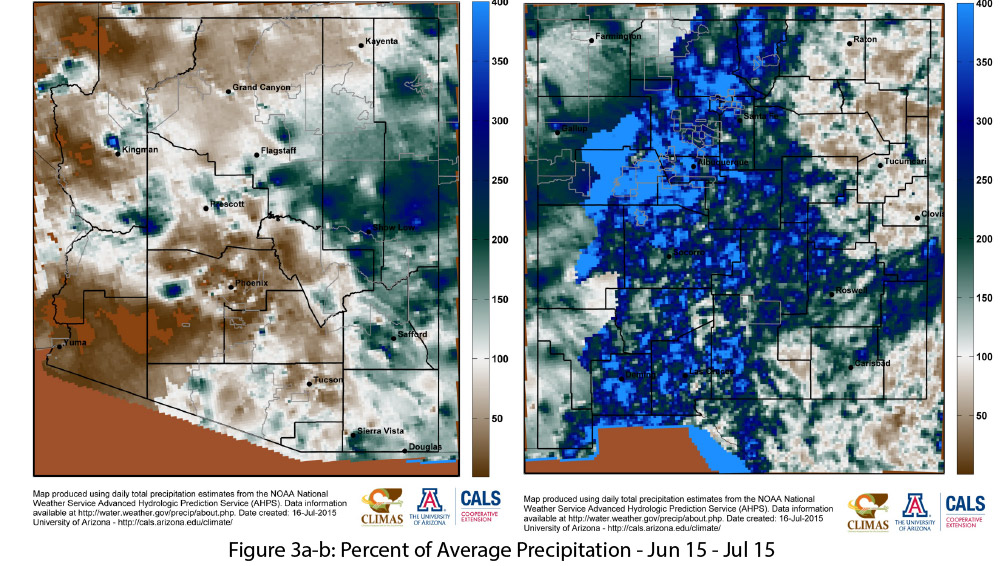
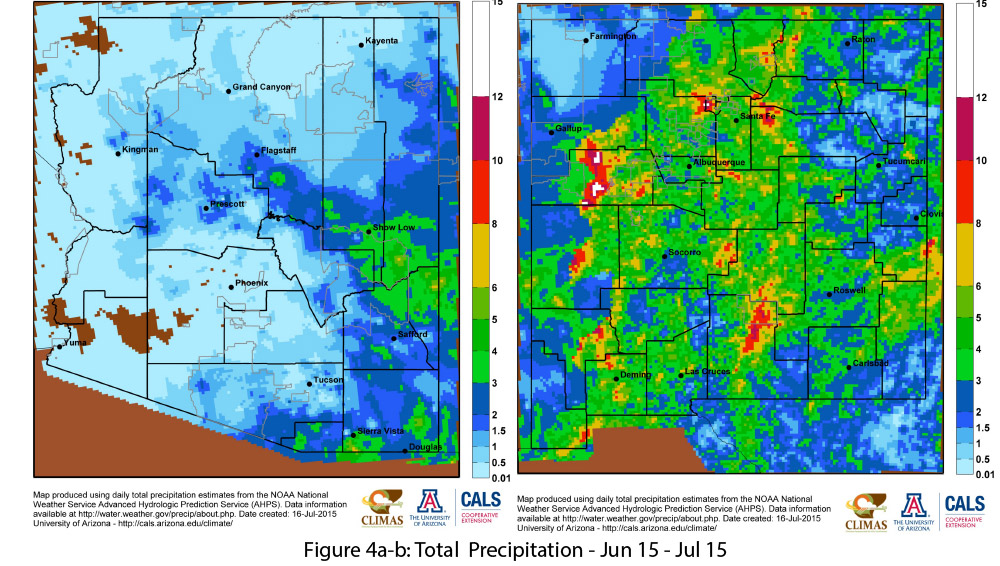
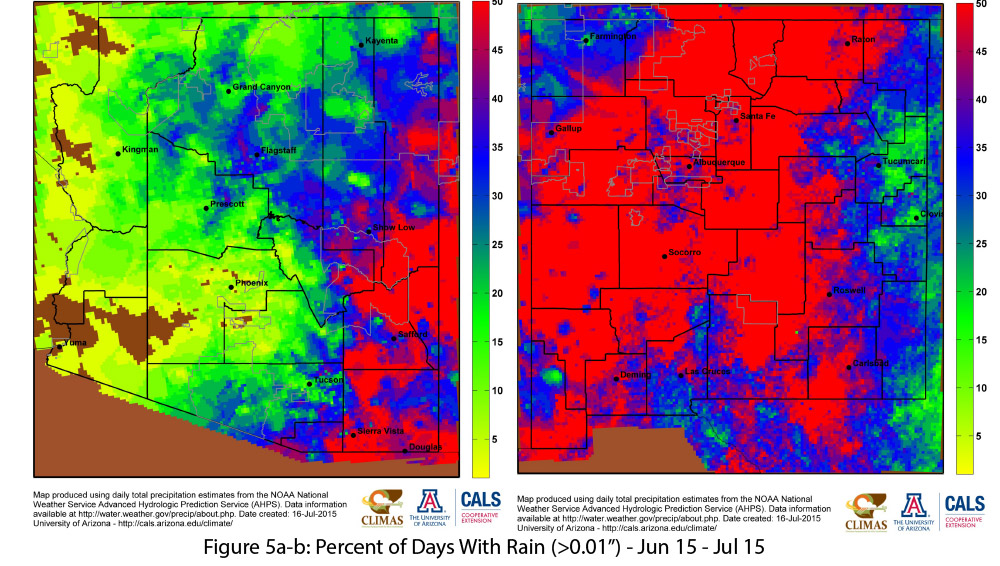
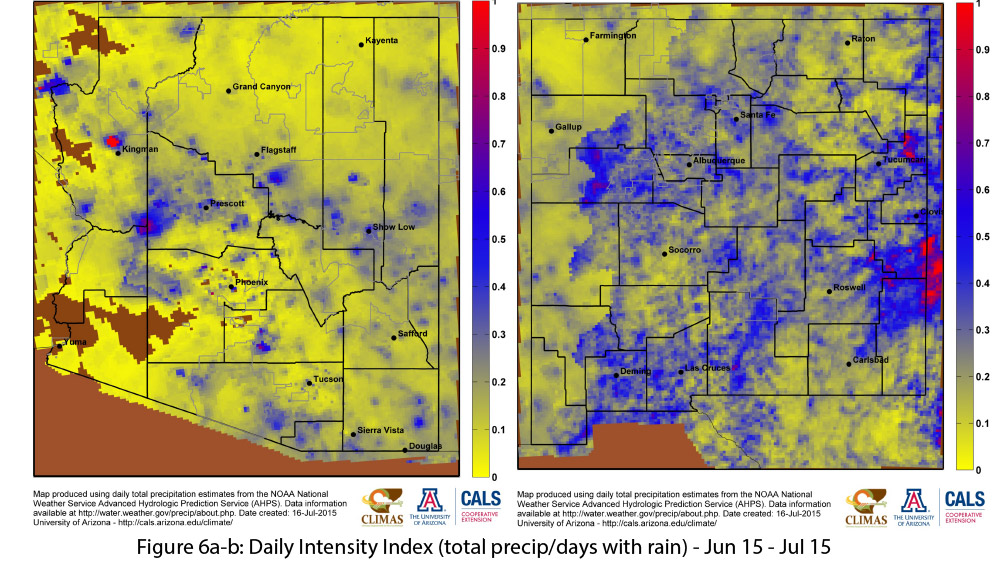
In the first month of the monsoon, most of New Mexico and much of eastern Arizona received well-above-average precipitation (Fig. 3a-b), albeit with a wide range of precipitation totals across the region (Fig. 4a-b). Western Arizona (particularly the southwest and northwest corners) are notable exceptions to this pattern, although these regions typically receive far less monsoon precipitation overall. The percent of days with rain highlights the regularity of monsoon precipitation thus far, with much of eastern Arizona and most of New Mexico recording rain events (>0.01”) on 35-50 percent of days since Jun 15 (Fig. 5a-b). The daily intensity index (Fig. 6a-b) further illustrates the steady nature of most of this monsoon precipitation, where higher values indicate much of the rain fell in a single event and lower values indicate more frequent and less intense events.