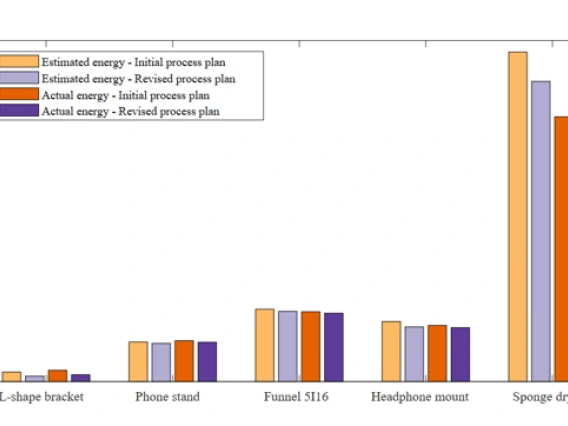
The World is My Oyster
Over the past eight years, I have lived in five different states as I have been pursuing my dream of becoming an environmental microbiology and water quality research scientist.
Monthly Precipitation and Temperature: April precipitation ranged between below average and above average in most of Arizona and between much below average and average in most of New Mexico (Fig. 1a). April temperatures were above average in most of Arizona and much of New Mexico (Fig. 1b). The daily average temperature anomalies for Apr 1 – May 20 (Fig. 2) highlight the fluctuations at select stations around the region.(Read More)
There are positive sea surface temperature (SST) anomalies across the equatorial Pacific (Figs. 1-2). Forecasts expect conditions will stay within the range of ENSO-neutral through at least summer 2020, with hints at a possible La Niña later in 2020.(Read More)
Monthly Precipitation and Temperature: March precipitation ranged between average and record wettest in Arizona and between below average and record wettest in New Mexico (Fig. 1a). March temperatures were average to much above average in Arizona and above average to much above average in New Mexico (Fig. 1b). The daily average temperature anomalies for Mar 1 – Apr 14 (Fig. 2) highlight the fluctuations at select stations around the region.(Read More)
Monthly Precipitation and Temperature: February precipitation ranged from below average to much below average in Arizona and New Mexico (Fig. 1a), while February temperatures were average to above-average across nearly all of Arizona and New Mexico (Fig. 1b). The daily average temperature anomalies for Feb 1 – Mar 18 (Fig. 2) highlight the fluctuations at select stations around the region. (Read More)
Positive sea surface temperature (SST) anomalies remain in the equatorial Pacific, particularly in the western regions (Figs. 1-2). Despite lingering warm waters, forecasts expect overall conditions will stay in the range of ENSO-neutral through at least summer 2020.(Read More)
Monthly Precipitation and Temperature: January precipitation ranged from average to much below average in most of Arizona, while New Mexico was mostly average, but included areas that ranged from below average to above average (Fig. 1a). January temperatures were above average across nearly all of Arizona and New Mexico (Fig. 1b). The daily average temperature anomalies for Jan 1 – Feb 17 (Fig. 1b) highlight the fluctuations at select stations around the region. Particularly notable was the cold snap in early February. (Read More)
Positive sea surface temperature (SST) anomalies persisted in the equatorial Pacific, particularly in the western regions (Figs. 1-2). Despite these lingering warm waters, SSTs are expected to remain within the range of ENSO-neutral at longer timescales. (Read More)
Warm waters continue to linger in the equatorial Pacific (Figs. 1-2), and while sea surface temperatures (SSTs) are expected to fall back within the range of ENSO-neutral, some forecasters made note of these warm conditions as something to keep an eye on in 2020. (Read More)
Monthly Precipitation and Temperature: December precipitation was average to above average in most of Arizona, while New Mexico ranged from below average to above average (Fig. 1a). December temperatures were average to above average in Arizona and above average to much above average in New Mexico (Fig. 1b). Daily average temperature anomalies for Dec 1 – Jan 15 (Fig. 2) highlight the fluctuations at select stations around the region. Positive anomalies reflect above average daily temperatures, while negative anomalies reflect below average daily temperatures. The histograms show the frequency of the anomalies for each location. (Read More)