Monsoon Summary Jun 15-Sep 17
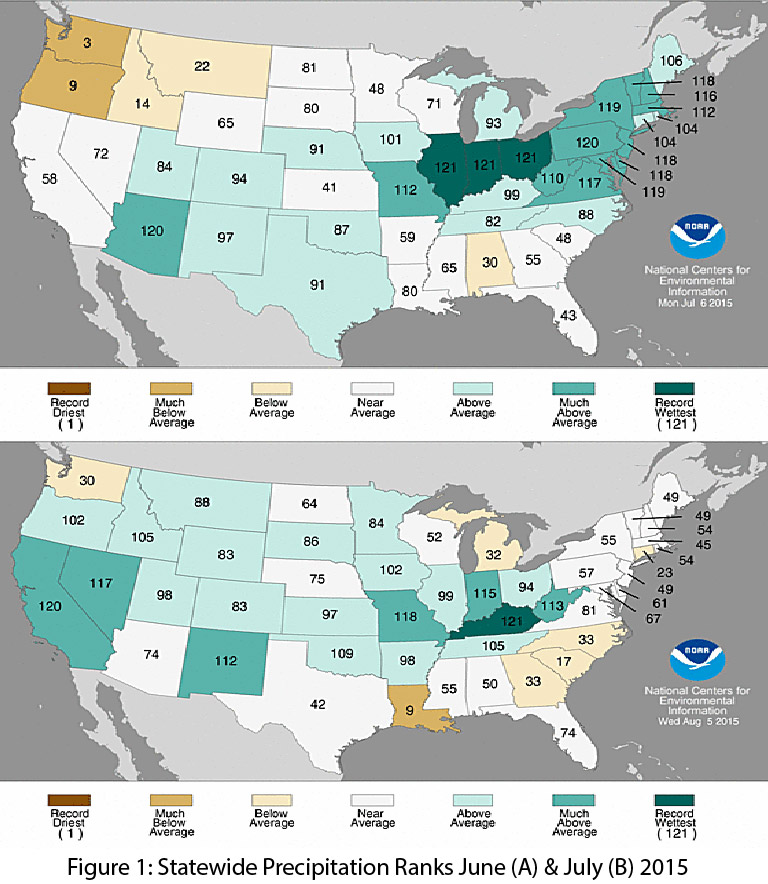
The monsoon started strong in late June and early July. This early start centered on Arizona, which recorded its second wettest June on record (Fig. 1a), with a return to relatively normal rainfall totals in July. New Mexico saw an increase in precipitation, recording its 10th wettest July on record (Fig. 1b). Rainfall in August and September was mostly below average, which is characteristic of the North American monsoon’s sporadic and spatially limited precipitation events.
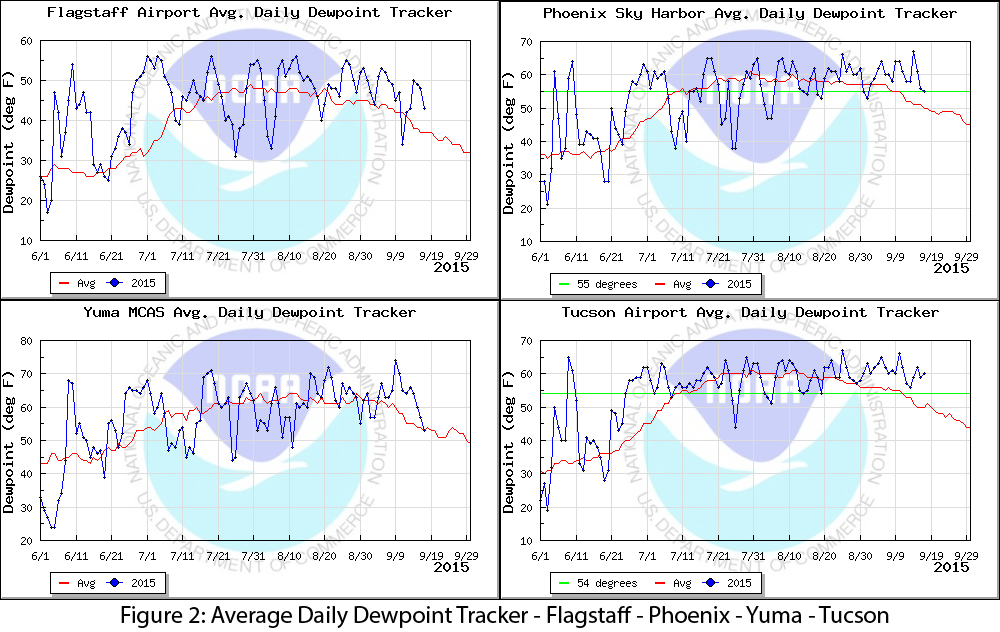
These shifts in persistence and intensity are tied to the strength and location of the monsoon ridge, which, depending on its location, can facilitate the flow of organized storm activity from the south or east (during increased monsoon activity) or can shift the flow such that we see extended periods of decreased precipitation. The later season weakening of the monsoon ridge since early July is likely due at least in part to increasing El Niño convection. With this El Niño event set to be one of the strongest on record, it is not surprising that it may have had an expected disruptive effect on monsoon circulation. We also continue to watch eastern Pacific tropical storm activity as it helps drive moisture into the region, a pattern we’ve seen repeatedly in the past few weeks with a number of tropical storm systems, particularly Linda. The effects of these systems can be intense and spatially variable, with southern Arizona experiencing increased humidity and little additional precipitation, compared to serious flooding in northern Arizona and southern Utah. Regional dewpoint readings also illustrate the variability of monsoon activity and the influence of tropical storm activity (Fig. 2).
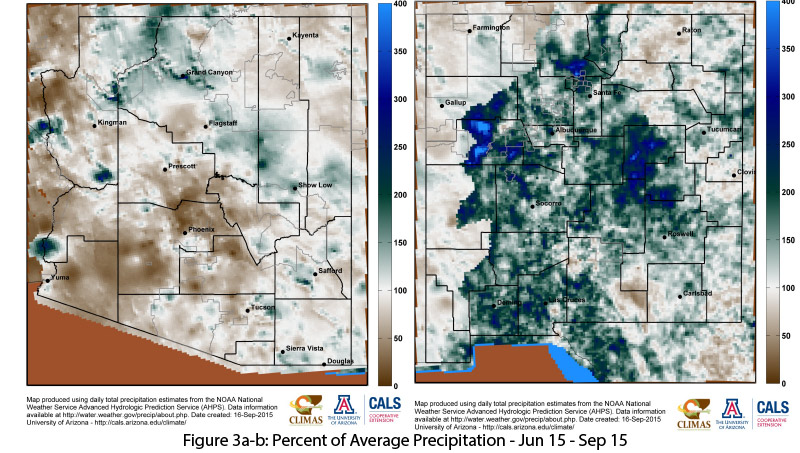
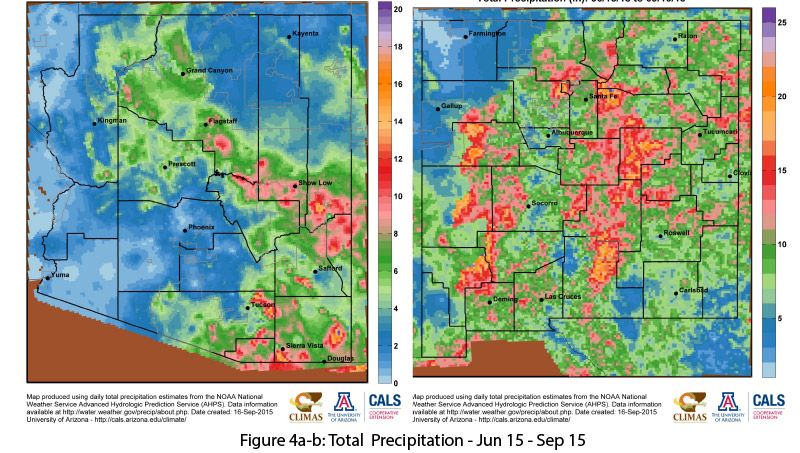
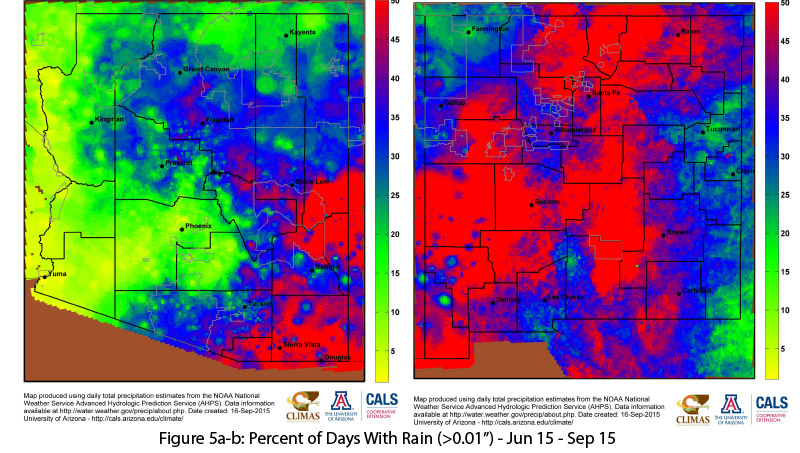
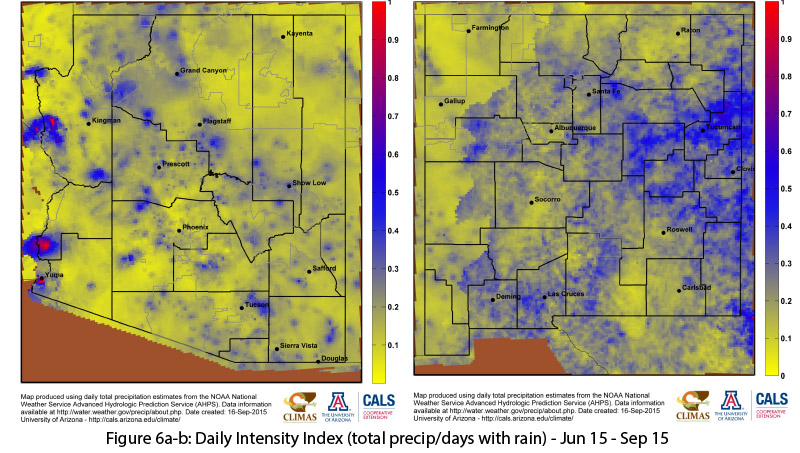
Looking at cumulative totals to date for the 2015 monsoon, precipitation as a percent of average demonstrates the spatial variability of monsoon precipitation (Figs. 3a–b), while raw precipitation totals show the wide range of normal precipitation totals we see across the Southwest (Figs. 4a–b). These totals can be skewed by a few strong events or even a single strong storm; the percent of days with rain (Figs. 5a–b) highlights the regularity of monsoon precipitation thus far, with much of Arizona and nearly all of New Mexico recording rain events (greater than 0.01 inch) on at least 25 percent of days since June 15. The daily intensity index (Figs. 6a–b) further illustrates the steady nature of most of this monsoon precipitation; higher values indicate much of the rain fell in a single event and lower values indicate more frequent and less intense events.