SW Climate Outlook Monsoon Recap - Oct 2017
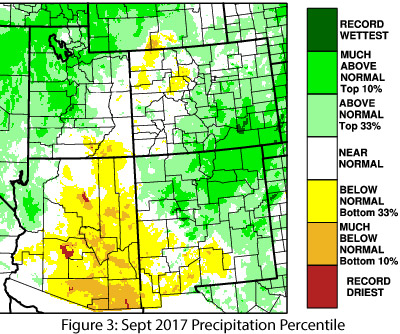
The North American Monsoon was quiet for much of the Southwest through early July. The rest of July was active and numerous locations approached or set single-month precipitation records. August saw a widespread shutdown of monsoon activity across much of Arizona, which lasted for the rest of the official season. During the same period, New Mexico saw more consistent precipitation activity, including a last gasp in late September when a cluster of storms hit both central and far southern parts of the state. Weather stations in regional metropolitan areas recorded mostly average to above-average totals (Fig. 3 on p.2), with the larger anomalies in Tucson and El Paso attributed to near-record July precipitation. Conversely, Yuma and Albuquerque had been lagging behind their seasonal averages but received late-season boosts to their seasonal totals.
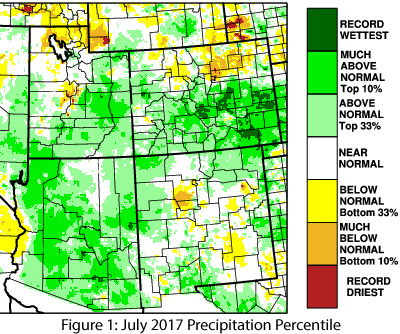
Precipitation rank maps reveal July was mostly above normal (top 33 percent) and much-above normal (top 10 percent) across nearly all of Arizona and much of western and northern New Mexico (Fig. 1). August flipped that script, with most of Arizona and western New Mexico recording below-normal or much-below-normal precipitation, and with a large pocket of dry conditions centered over the Four Corners region even while eastern New Mexico was much-above normal to record wettest (Fig. 2). September was a variation on that theme, with most of Arizona and southwestern New Mexico recording below-normal or much-below-normal precipitation while northwestern Arizona and northern and eastern New Mexico recorded above-normal to much-above-normal precipitation (Fig. 3).

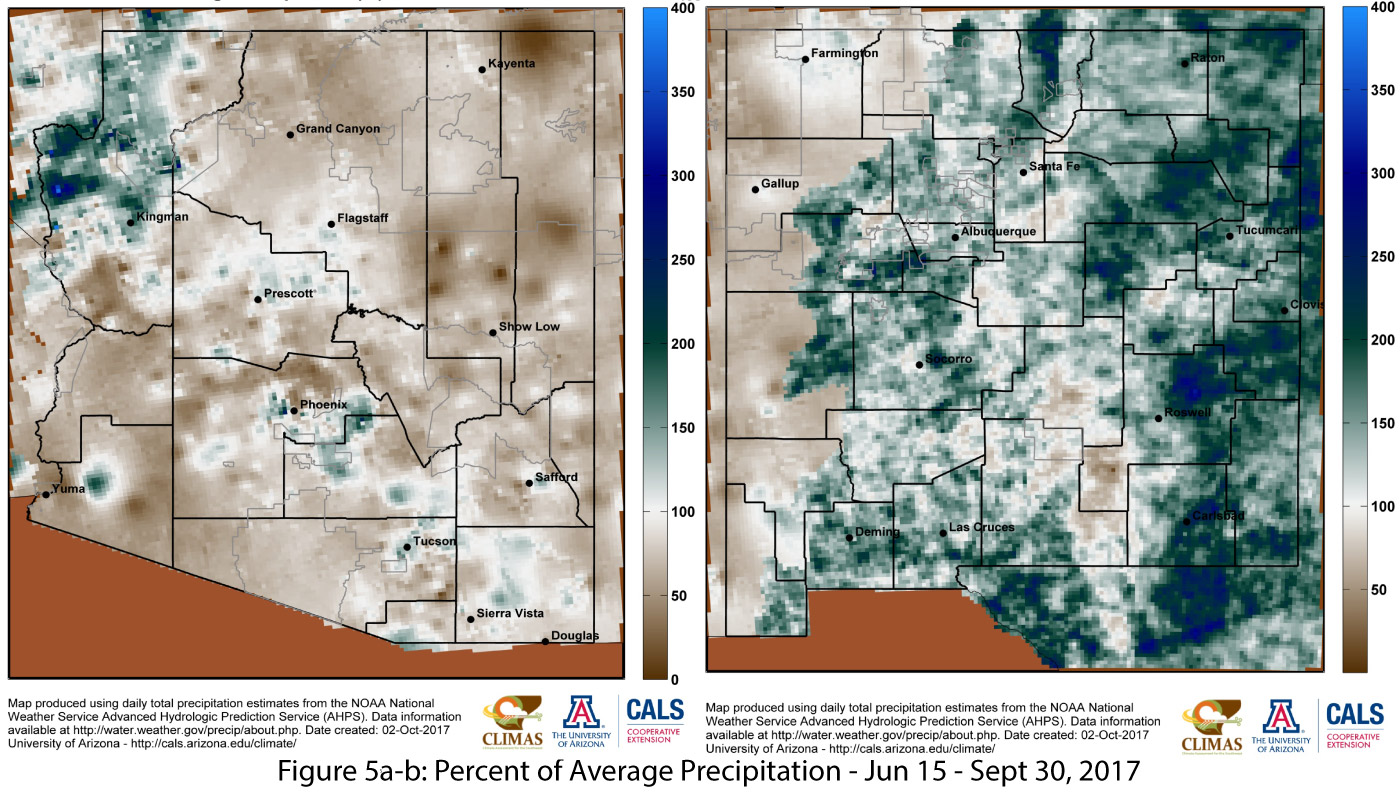
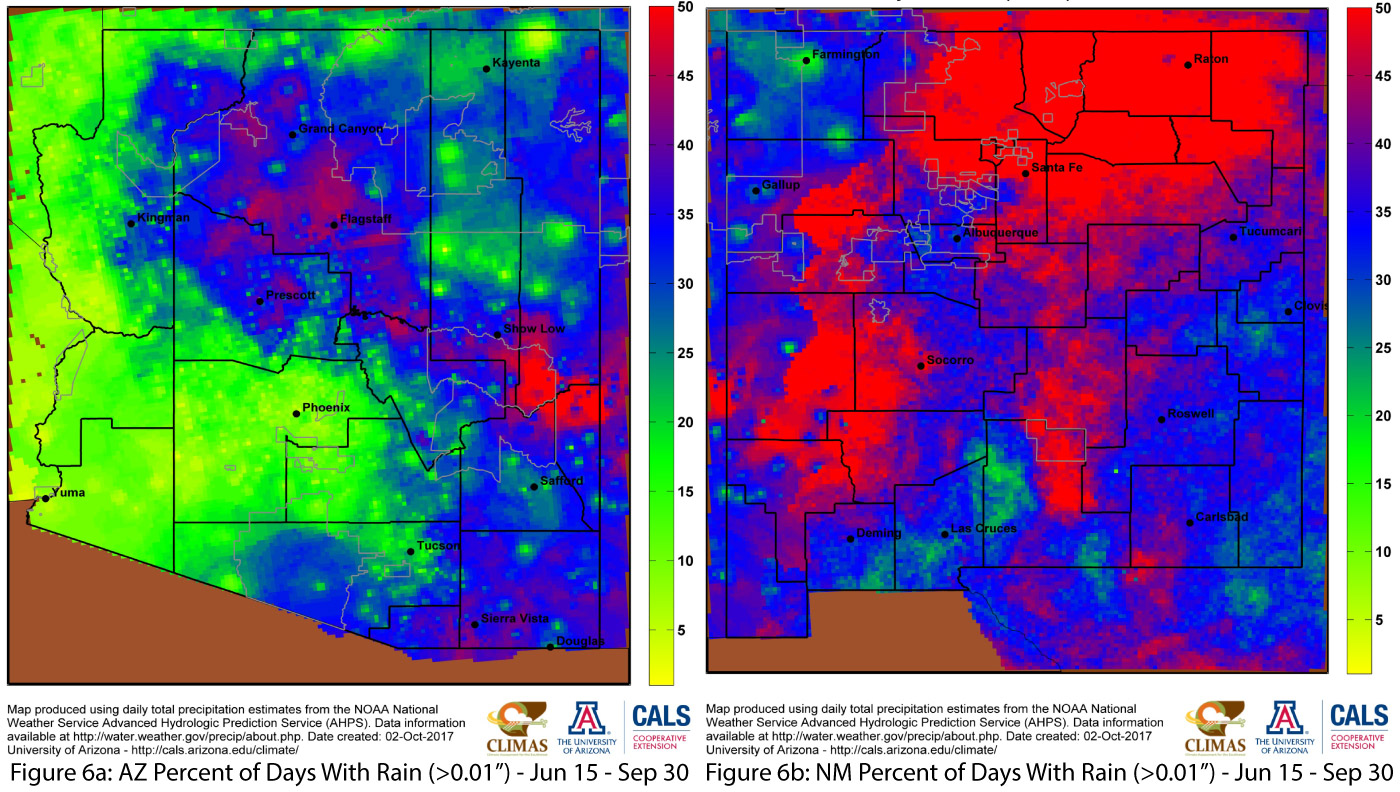
The cumulative seasonal precipitation totals diminish the more extreme monthly variations (Fig. 4), with percent of total and days with rain revealing a high degree of spatial heterogeneity of precipitation totals and frequency across the region (Figs. 5-6 on p.4).

SW Monsoon - Station Case Studies
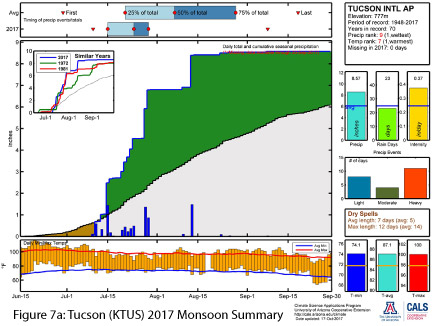
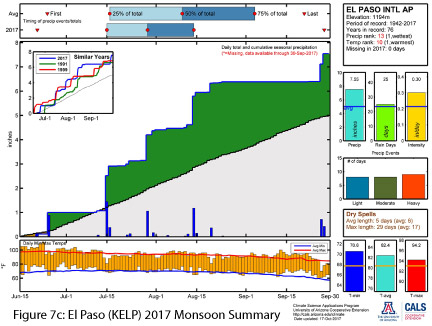
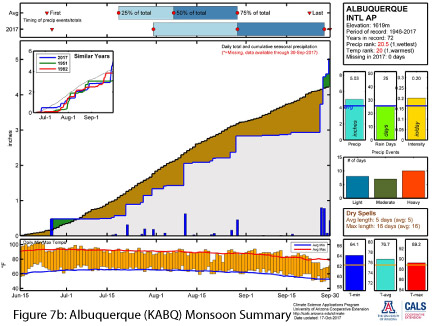
Cumulative precipitation maps help illustrate where monsoon precipitation fell, and the monthly maps on p.3 narrow down when it fell, but a closer look at individual stations reveals the variety of ways the monsoon can progress. The cumulative plot for Tucson (KTUS: Fig. 7a) shows the slightly-behind-normal start, the strong series of storms from mid-July to early August, and the complete shutdown of monsoon activity after mid-August. Albuquerque, on the other hand, had an early event but then lagged behind the seasonal total for most of the monsoon before a run of storms pushed the city just over its seasonal average at the end of September (KABQ: Fig. 7b). El Paso looks to be the best of both worlds, with an early start, a strong set of storms in the middle, and a season-ending event that pushed the total even further past the seasonal average (KELP: Fig. 7c). A closer look at the daily rainfall totals reveals a vast majority of El Paso’s monsoon rainfall fell during a small number of intense rainfall events. Each of the three cities had similar overall results – above-average monsoon totals – but each followed a different pattern to reach those totals.
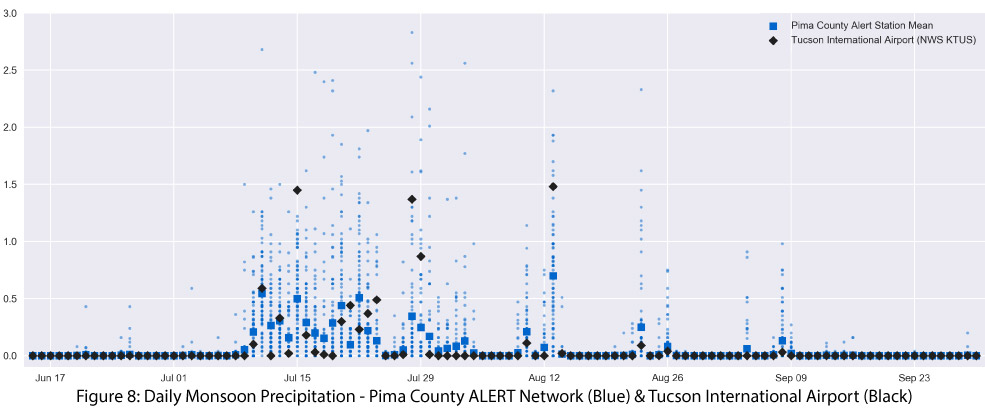
CLIMAS developed an experimental product using the Pima County ALERT network data that further reveals the range of precipitation totals that occur during monsoon events. Figure 8 plots the daily precipitation totals from the KTUS NWS station used for Figure 7a, along with the range of precipitation totals recorded at the various network stations around Pima county.
Online Resources