Monsoon Recap - June 15 - Sept 30, 2014
Looking back on the 2014 monsoon, a simple characterization of the season as ‘normal’ or ‘average’ (or above or below these thresholds) is difficult, given the spatial and temporal variability of monsoon storms. The cumulative seasonal totals provide one way of characterizing the monsoon, and by those metrics, the Southwest saw an average to above-average summer rainy season, with much of Arizona and New Mexico receiving well above-average rainfall.
Most of Arizona received well above-average monsoon rainfall—200 to 400 percent of average—and many areas in the state registered 150 percent of their seasonal total or higher. The exceptions were across most of the Four Corners region and in portions of Pima, Pinal, and Graham counties (Fig. 1a). Precipitation intensity (Fig. 2a) identifies areas that received a significant portion of their monsoon precipitation in a few extreme events, with the Phoenix metropolitan area and portions of western Arizona being prime examples of more intense precipitation. Figure 3a (the percentage of days observing 0.01 inch of rain or more) further illustrates this pattern by highlighting areas that received more frequent and steady rain (e.g., much of the southeastern portion of the state) compared to areas with much less frequent rain (e.g., Phoenix, western Arizona, and the Four Corners region).
New Mexico saw a similarly strong, if not stronger, monsoon, with most areas of the state receiving more than 200 percent of their seasonal average and large swaths of southern New Mexico recording between 300 and 400 percent of their seasonal average (Fig. 1b). The exceptions were the Four Corners region and the northeastern corner of the state. New Mexico monsoon precipitation intensity (Fig. 2b) shows a relatively even pattern, with more widespread coverage and less variability compared to Arizona. The graphic depicting percent of days with rain in New Mexico (Fig. 3b) shows larger areas of more frequent but less intense precipitation, with a large percentage of the state experiencing measurable precipitation on at least a third of days during the monsoon.
![]()
![]()
![]()
 The variability and intensity of these storms is only hinted at in seasonal totals however, and the monsoon is notoriously spatially variable and inconsistent. It is not uncommon for 1–2 inches of rain to fall in midtown Tucson and be dry in the foothills, or vice versa, for example, and many metrics are based on the placement of a limited number of rain gauges. This is an important point because during numerous precipitation events this season, a single storm dropped a season’s worth of rain in a day (and in a few cases, in a few hours), but the coverage was not always consistent or uniform.
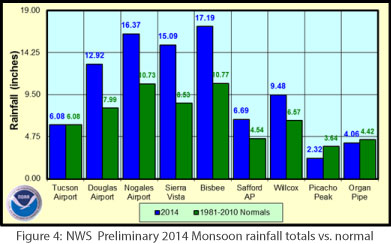
These storms also drive above-average seasonal totals, which has a limited effect on mitigating drought compared to steady and consistent rains, increase disaster potential due to intense precipitation (e.g., Tropical Storm Norbert in Phoenix and Tucson), and underscore the complexity of planning a large urban area for a possible storm event (e.g., Tropical Storm Odile in Tucson). Citizen science enterprises such as rainlog.org provide a more detailed and nuanced picture of monsoon variability through crowdsourcing of precipitation measurement, but the standard measure is still a comparison of the seasonal totals measured at stations in the Southwest (Fig. 4). The intensity and percent of days with rain (Figs. 2-3, above), help illustrate different patterns of steady vs. intense precipitation, but cumulative monsoon precipitation plots also help clarify variation in precipitation intensity.
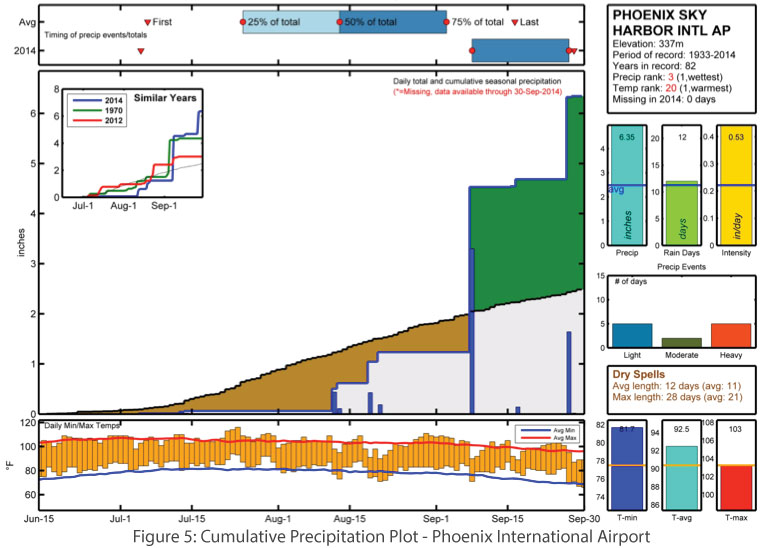
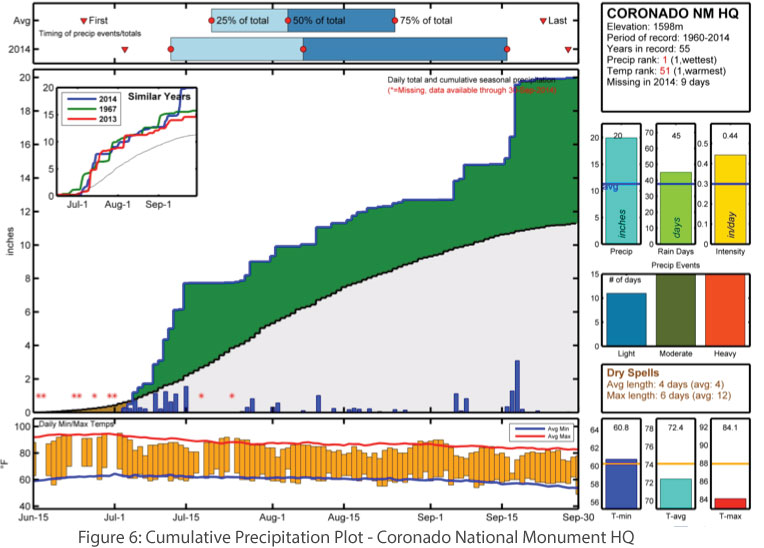
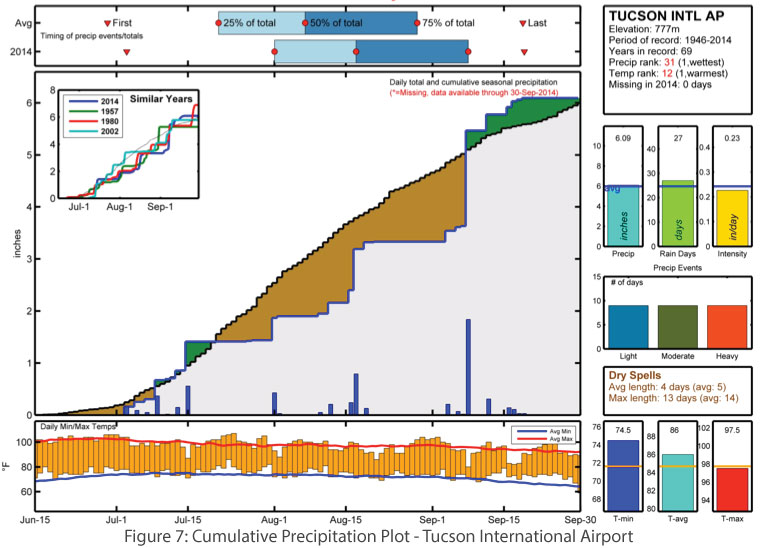
Three plots (Figs. 5-7) help explain these different types and intensities of rain events. In September, Phoenix (Fig. 5) received almost all of its monsoon precipitation in two single days, and a majority of the rain fell in a single day when Norbert pushed in from the Gulf of California on Sept. 7. The precipitation plot for the Coronado National Monument (Fig. 6) shows a much more even precipitation pattern, with numerous smaller storms spread out over the season; the largest single-day rain event was associated with the incursion of moisture from Odile). The precipitation plot for Tucson (Fig. 7) falls in the middle, with more frequent and smaller storms compared to Phoenix, but longer dry spells and gaps in monsoon precipitation compared to Coronado NM HQ. Norbert is also clearly identifiable in this plot.
This comparison helps illustrate that while extreme precipitation events may provide short-term drought relief and precipitation totals may indicate water deficit improvements, long-term drought conditions will persist and are best mitigated by similarly long-term patterns of above-average precipitation, especially as we look forward to the winter precipitation season.
This post was originally published as part of the October 2014 Southwest Climate Outlook