Feb 2018 Southwest Climate Outlook - La Niña Events in the Southwest
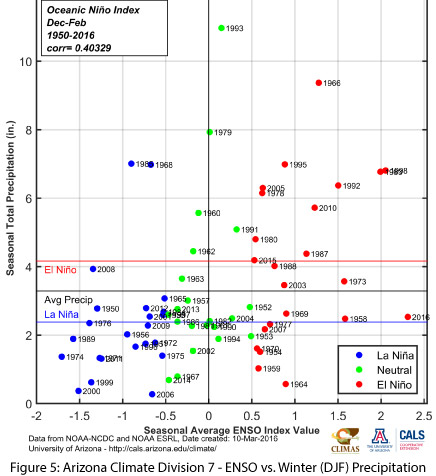
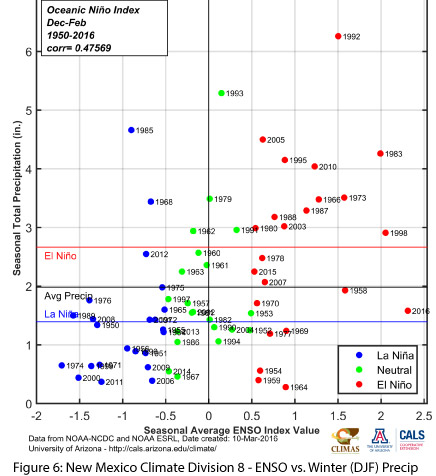
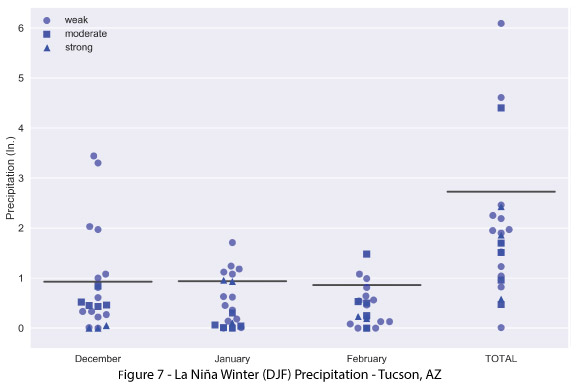
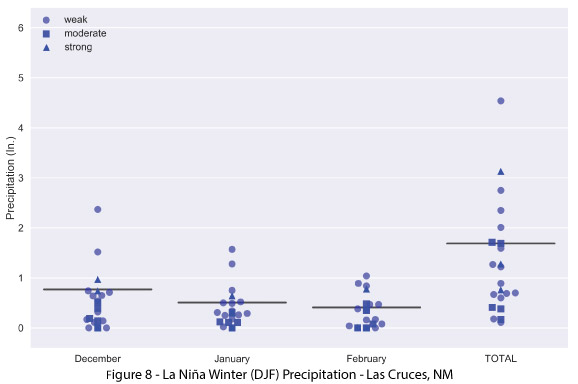
Winter precipitation (Dec-Feb (DJF)), during most weak La Niña events (ENSO Index Value between -0.5 and -1.0) has been below average, although a few years (1968, 1985) were notable outliers (Figs. 5-6). The monthly breakdown of weak, moderate, and strong La Niña events reveals that while the DJF totals for Tucson, AZ and Las Cruces, NM have been mostly below average (Figs. 7-8), there have been individual months that recorded precipitation above the monthly average (represented by black lines on the plots). The most likely outcome for the Southwest this year is below-average precipitation totals for the winter season, but the way that these events unfold will have an impact on how residents perceive and experience this La Niña event (see the following page for examples from Arizona and New Mexico during La Niña events).
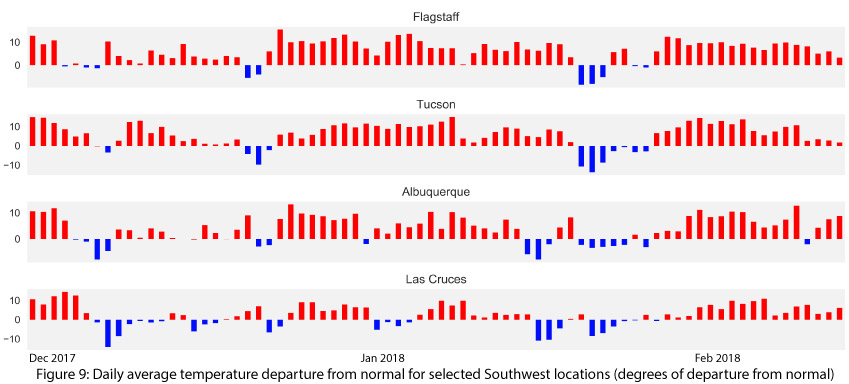
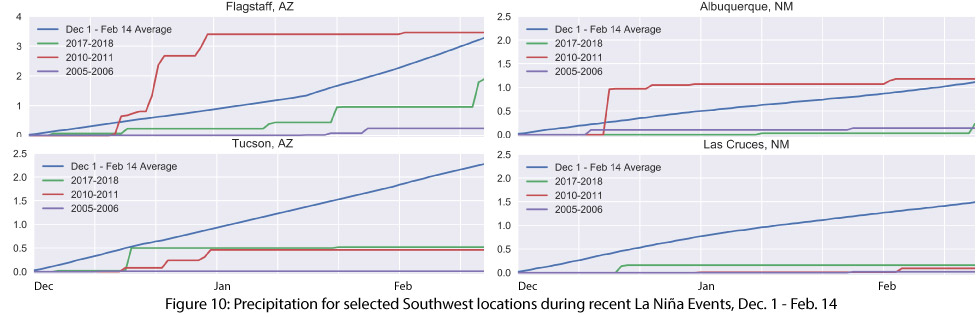
Recent La Niña Events - Winter Temperature & Precipitation (Dec 1 - Feb 14)
Temperature anomalies (show below as departures from normal) have been mostly warmer than average during the core of this winter season (Dec 1-Feb 14) across the Southwest (Fig 9). The accumulation plots in Figure 10 display the average precipitation for this timeframe (blue), the observed precipitation this year (green), and the observed precipitation for two recent La Niña events (red, purple) (Fig. 10). These plots reveal similar accumulation patterns, especially in the southern locations, and highlight just how far behind the normal accumulation we are in most of the Southwest.