El Niño Tracker - Dec 2015
El Niño conditions continued for a 10th straight month, and models continue to forecast a strong El Niño event that will last through spring 2016 and remain strong through the early part of the year. Forecasts focused on the persistence of sea surface temperature (SST) anomalies (Figs. 1–2) and weakened trade winds, enhanced convective activity in the central and eastern Pacific, and El Niño-related ocean-atmosphere coupling. Notably, the SST values in the Niño 3.4 region were at or above the record values in November. Climate scientists have been quick to point out that numerous factors contribute to the overall strength of El Niño, but we are certainly seeing one of the strongest events on record.
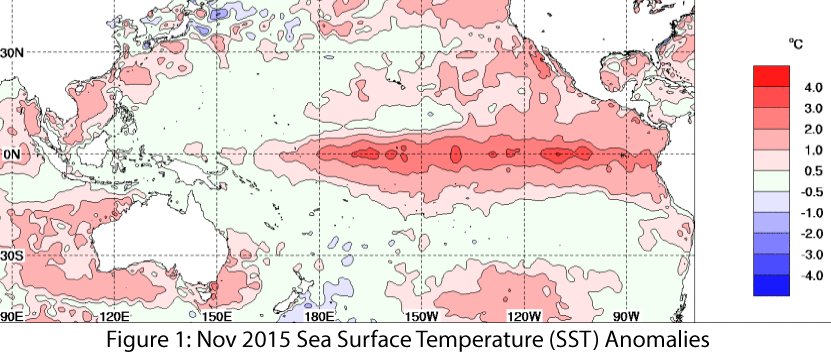 Image Source - Australian Bureau of Meteorology
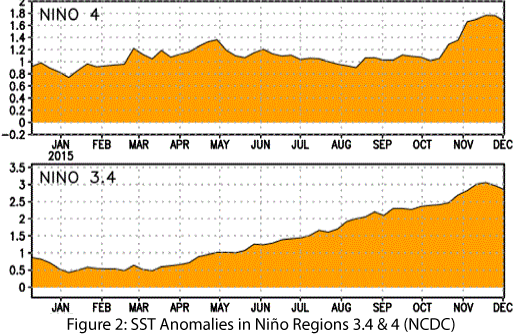 Image Source - NOAA/NWS - Climate Prediction Center
On Dec. 8, the Australian Bureau of Meteorology maintained its tracker at official El Niño status, with the event having likely reached its peak. On Dec. 10, the Japan Meteorological Agency identified ongoing El Niño conditions as having reached their “mature stage” in the equatorial Pacific and “remarkably above-normal” SST anomalies and atmospheric convective activity. The agency projected that El Niño would remain in place through spring 2016 before transitioning to ENSO-neutral by summer. Also on Dec. 10, the NOAA-Climate Prediction Center (CPC) extended its El Niño advisory and identified the current atmospheric and oceanic anomalies as reflecting a strong El Niño event that will be one of the three strongest events on record. CPC models indicate the El Niño event will persist through winter, with a transition to ENSO-neutral conditions by late spring or early summer. On Dec. 17, the International Research Institute for Climate and Society (IRI) and CPC forecasts indicated that all oceanic and atmospheric variables were indicative of a strong El Niño event, with consensus centering on strong El Niño conditions that will persist through spring 2016 (Fig. 3). The North American multi-model ensemble currently shows a strong event extending into 2016 with gradual weakening heading into spring (Fig. 4).
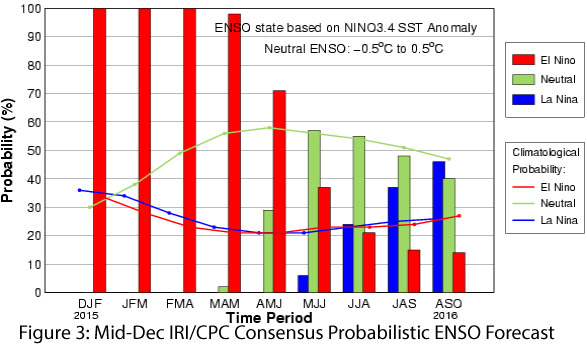 Image Source - International Research Institute for Climate & Society
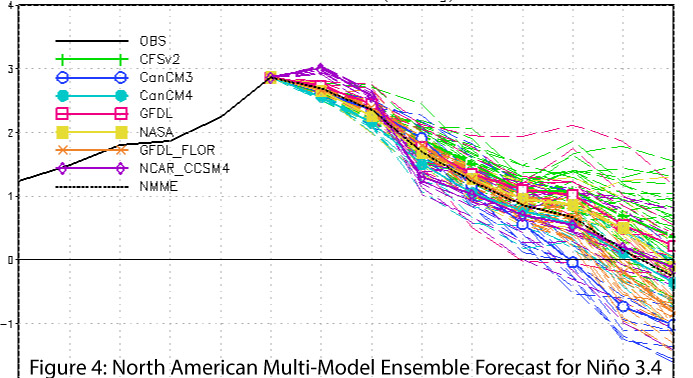 Image Source - NOAA/NWS - Climate Prediction Center
So what does this mean for the region? Seasonal forecasts and past events suggest we should see well above-average cumulative precipitation totals throughout our cool season, but we should also expect periods of inactivity between storms. Past events also suggest the best bets for seeing above-average precipitation will be in February and March, and perhaps later in January. Looking at the 1997–1998 event—the strongest El Niño event on record—most of Arizona and New Mexico received above-average precipitation in December but below-average rain and snowfall for all of January before returning to normal or above-normal precipitation in February and March (Figs. 5–8). At this point, we know a strong El Niño event is underway, and it will likely have a number of projected impacts on the Southwest (and the world), but we will need to wait until seasonal totals are in to accurately gauge the impact of El Niño.
 Image Source - Western Regional Climate Center - WestWide Drought Tracker
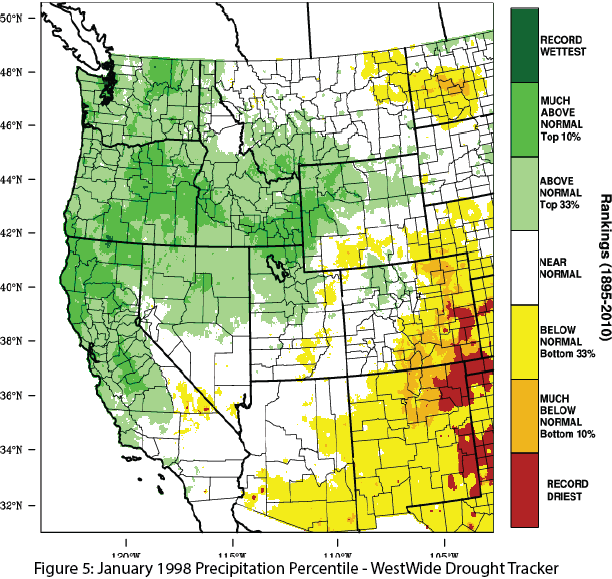 Image Source - Western Regional Climate Center - WestWide Drought Tracker
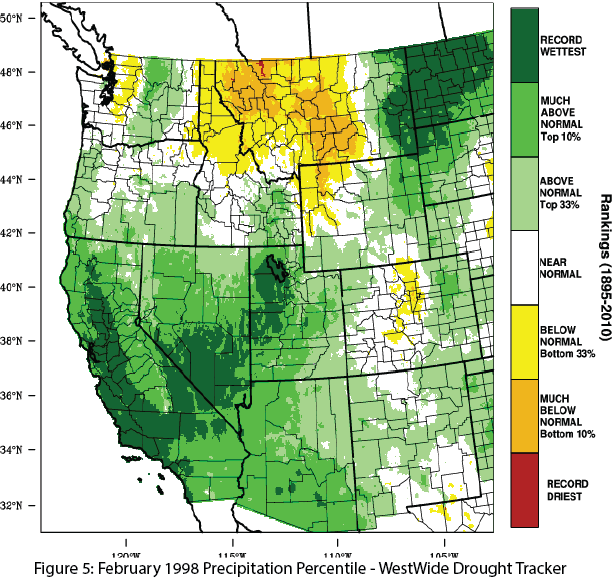 Image Source - Western Regional Climate Center - WestWide Drought Tracker
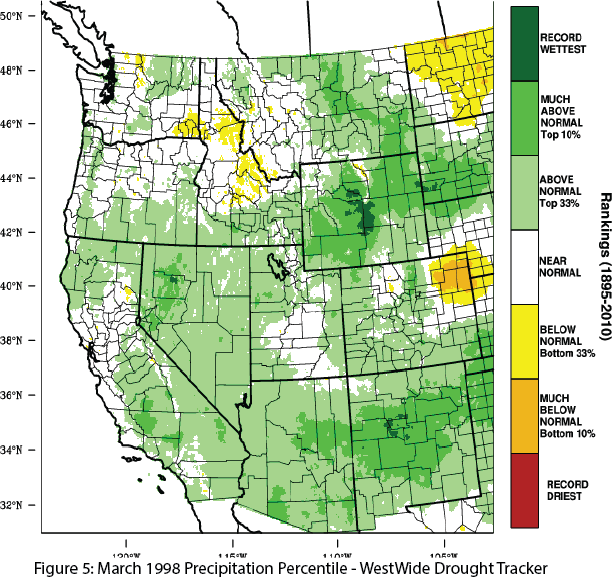 Image Source - Western Regional Climate Center - WestWide Drought Tracker
To provide data and analysis regarding possible impacts of El Niño on the Southwest, CLIMAS created an El Niño hub: climas.arizona.edu/sw-climate/el-niño-southern-oscillation
Please contact Dan Ferguson or Ben McMahan for more information