2015 Monsoon Recap - Oct 2015
Originally published in the October 2015 CLIMAS Southwest Climate Outlook
The monsoon started strong in late June and early July. This early start centered on Arizona, which recorded its second wettest June on record (Fig. 1a), with a return to relatively normal rainfall totals in July. New Mexico saw an increase in precipitation, recording its 10th wettest July on record (Fig. 1b). Following a break in the monsoon circulation, rainfall in August and September was average in Arizona and below average for New Mexico (Figs. 1c-1d). These statewide rankings do little to capture the spatial and temporal variability of the monsoon (see below), but they do give a sense as to the general character of the monsoon. As noted in the October SW Climate Podcast, the monsoon started strong, but tended to fizzle for most of August and September. However we did see a late season push from tropical storm activity, which helped push some of the monsoon seasonal precipitation totals just above average values.
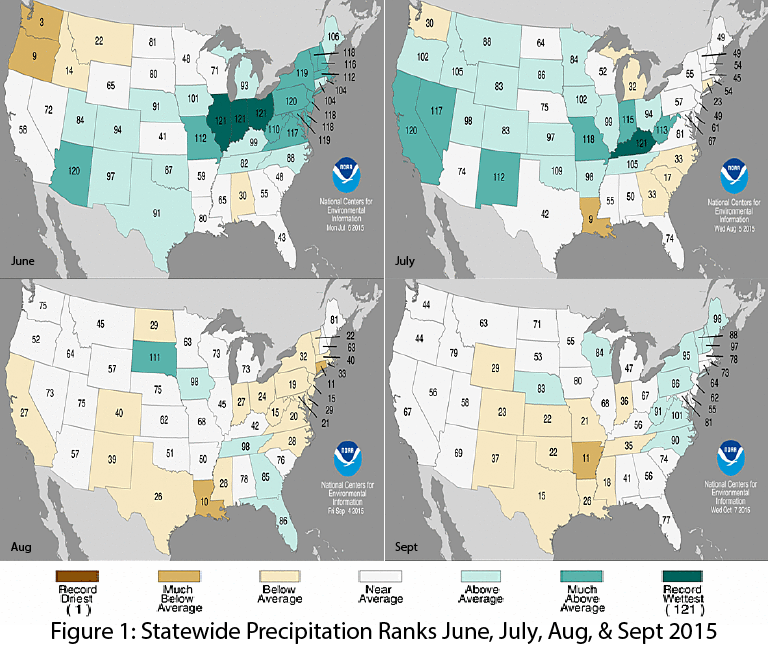 Image Source - NOAA - National Centers for Environmental Information
Shifts in the persistence and intensity of the monsoon are tied to the strength and location of the monsoon ridge, which, depending on its location, can facilitate the flow of organized storm activity from the south or east (during increased monsoon activity), or can shift the flow such that we see extended periods of decreased precipitation. The weakening of the monsoon ridge since early July is likely due at least in part to increasing El Niño convection. With this El Niño event set to be one of the strongest on record, it is not surprising that it may have had an expected disruptive effect on monsoon circulation.
A particularly notable characteristic of the monsoon this year was the persistently above average dewpoint temperatures we saw over the season (Fig. 2). This was likely linked to eastern Pacific tropical storm activity driving moisture into the region. In some cases, this provides a supplement to monsoon precipitation, as we saw this year with Linda, 16-E (and last year with Norbert and Odile). These storms can have intense and spatially variable effects, including increased precipitation and serious flooding, as well as driving up the humidity while adding little additional precipitation.
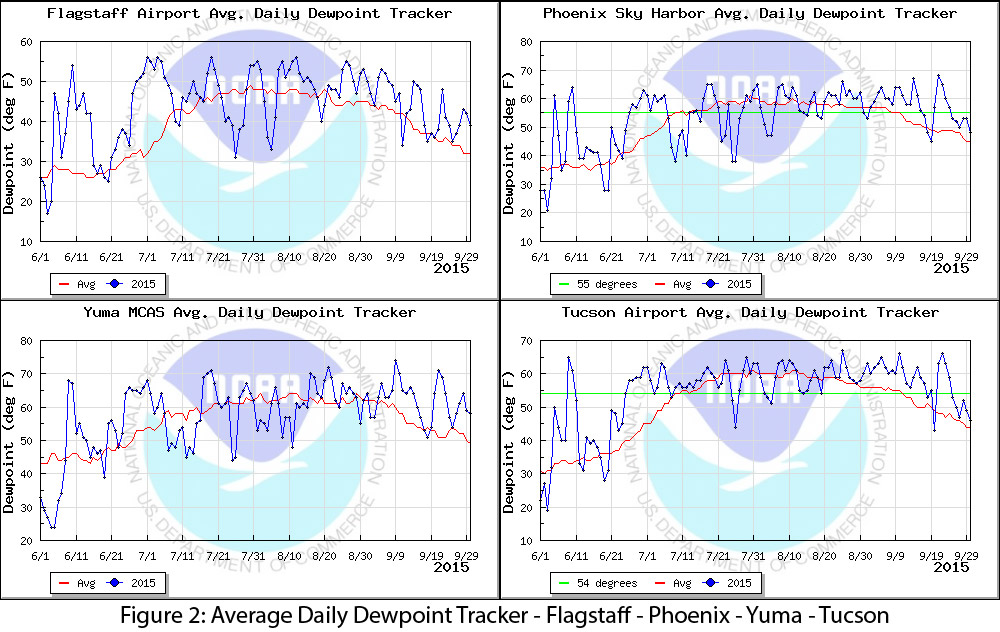 Image Source - National Weather Service
Monsoon Summary (June 15 - Sept 30)
Looking at cumulative totals for the 2015 monsoon, precipitation as a percent of average demonstrates the spatial variability of monsoon precipitation (Figs. 3a–b), while raw precipitation totals show the wide range of normal precipitation totals we see across the Southwest (Figs. 4a–b). These totals can be skewed by a few strong events or even a single strong storm; the percent of days with rain (Figs. 5a–b) highlights the regularity of monsoon precipitation thus far, with much of Arizona and nearly all of New Mexico recording rain events (greater than 0.01 inch) on at least 25 percent of days since June 15. The daily intensity index (Figs. 6a–b) further illustrates the steady nature of most of this monsoon precipitation; higher values indicate much of the rain fell in a single event and lower values indicate more frequent and less intense events.
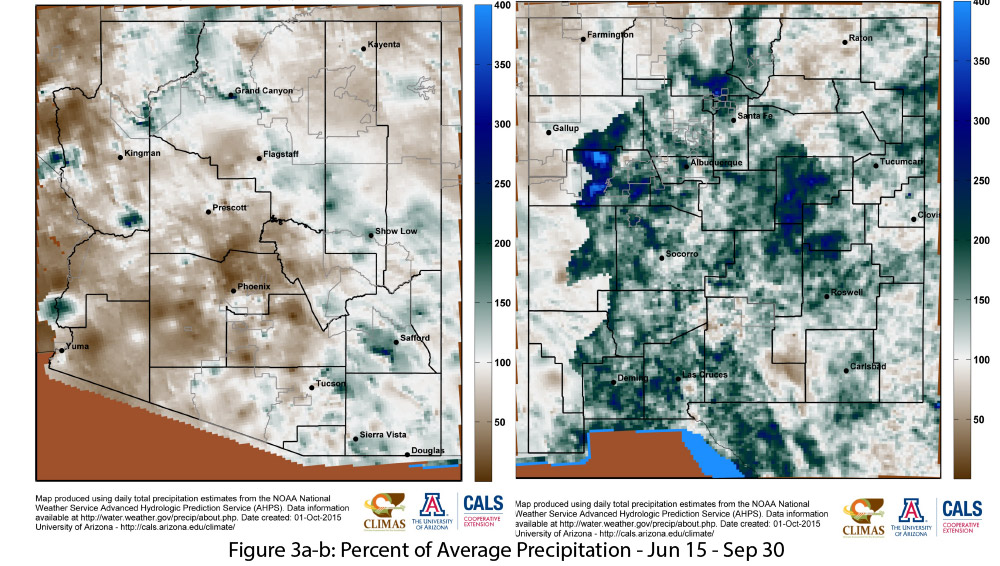
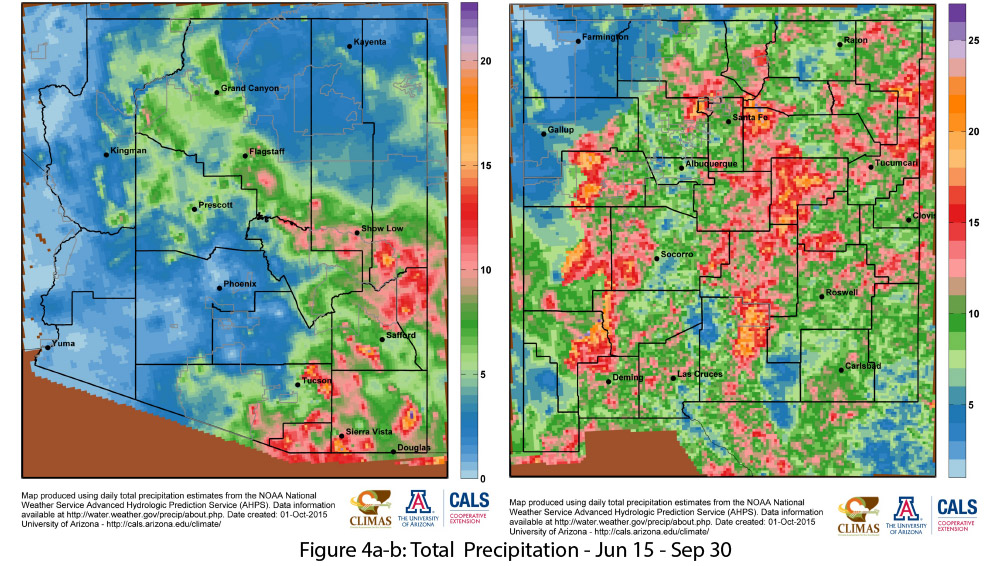
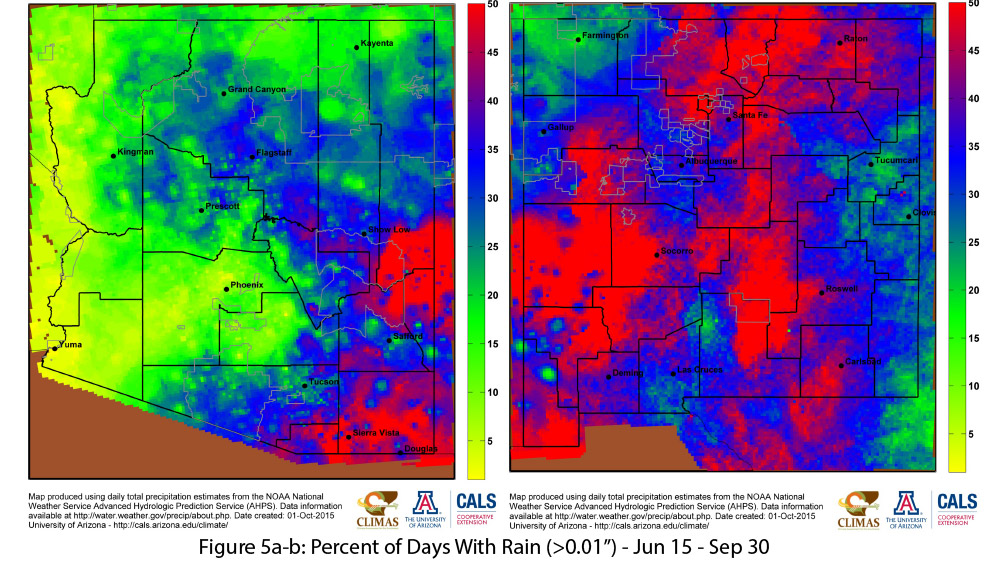
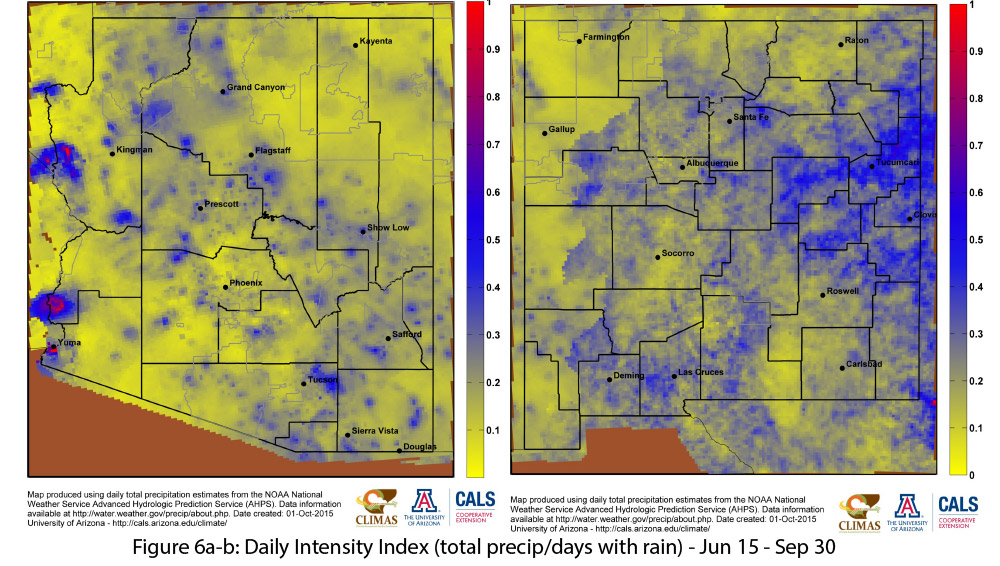 Image Source - Climate Science Applications Program