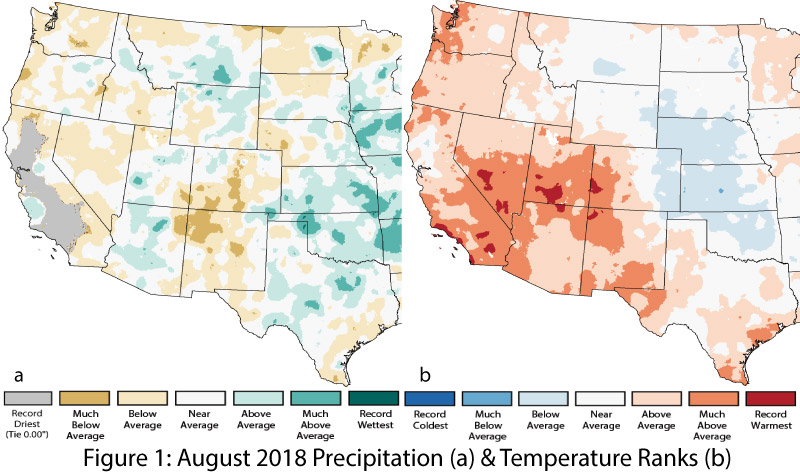
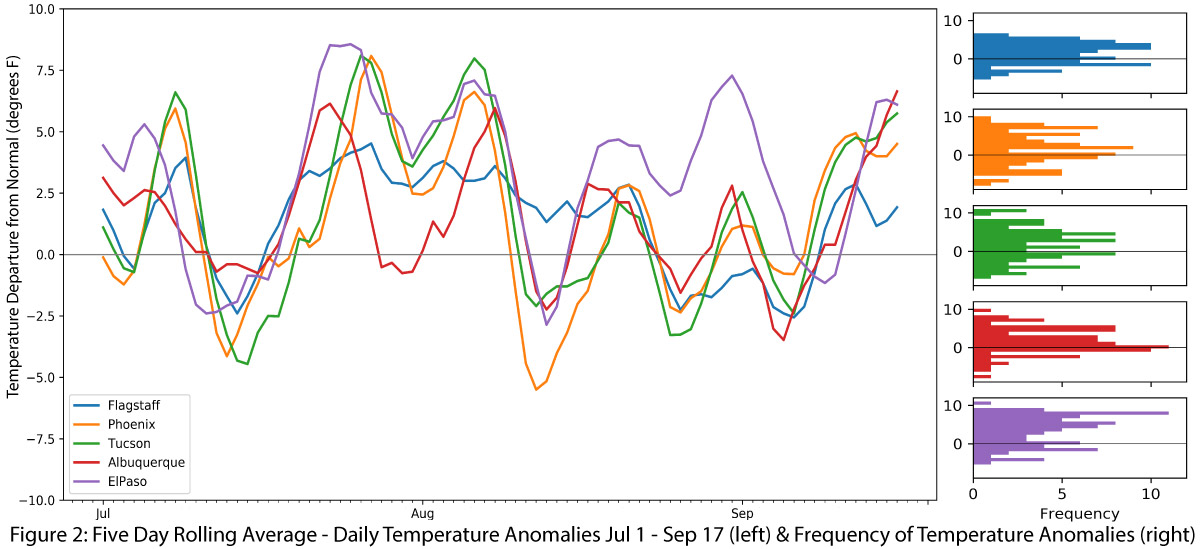
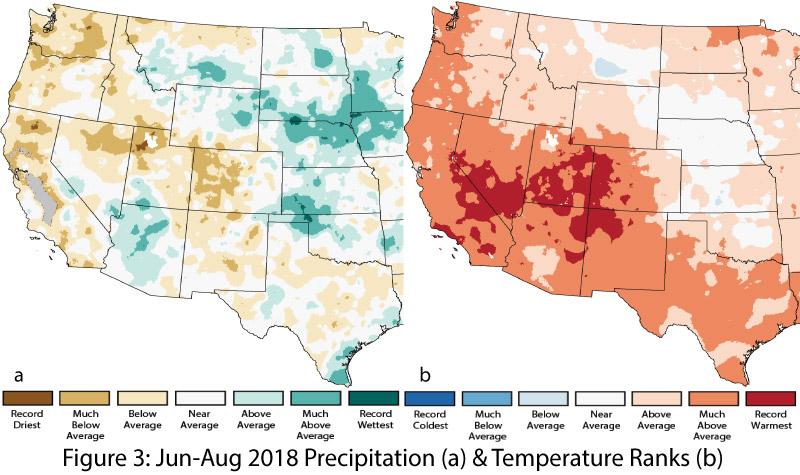
Precipitation and Temperature: Precipitation in August ranged from much-below average to average in New Mexico and from much-below average to above average in Arizona (Fig. 1a). August temperatures were mostly above average across Arizona and New Mexico, with swaths of much-above average and isolated locations of record-warmest conditions (Fig. 1b). Most of the daily temperature anomalies (deviations above or below the average temperature) have been warmer across the region since July 1 (Fig. 2). Summer (June-July-August) precipitation has varied considerably, from mostly average to below average in New Mexico, and from mostly average to above average in Arizona (Fig. 3).
Monsoon Tracker: Every monsoon is different, and this year has been characterized by abundant moisture available over much of the period, yet with a wide variety of precipitation totals (see Monsoon Tracker for details). This variability is characteristic of the monsoon, but we have seen fewer extended breaks in the monsoon compared to previous years.
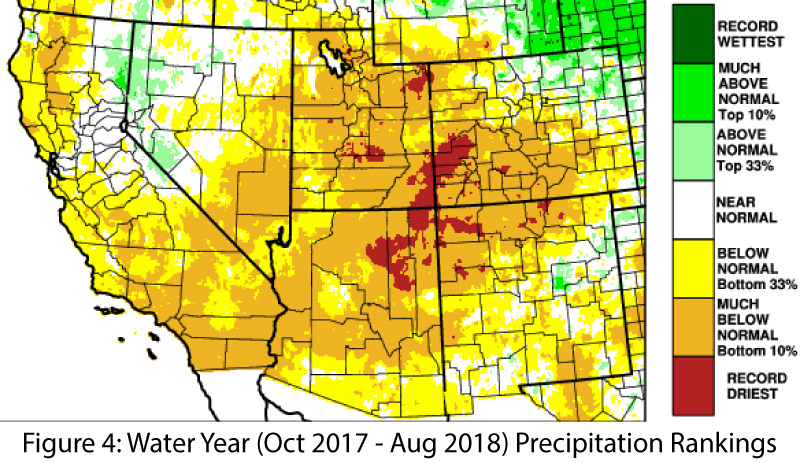
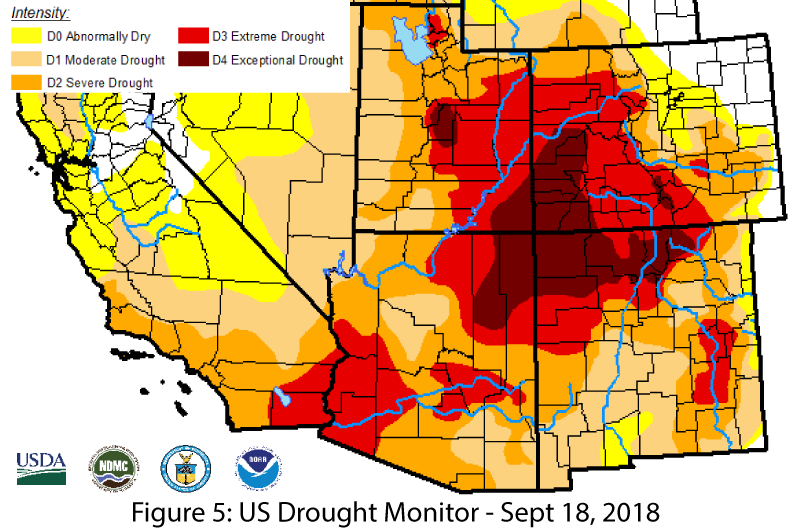
Drought: Water-year precipitation continues to highlight persistent moisture deficits in Arizona and much of New Mexico–particularly in the Four Corners region (Fig. 4). These conditions are reflected in the Sept. 18 US Drought Monitor, which identifies exceptional drought conditions (D4) in northeastern Arizona and northern New Mexico as well as less-intense drought designations (D1-D3) across the remainder of the two-state region (Fig. 5). The overall drought picture in the USDM characterization is actually improved from a few months ago, with smaller areas characterized as experiencing exceptional drought, but this in part reflects the highly localized nature of monsoon precipitation. The storms brought drought relief to localized areas, but others received below-average precipitation during the same time period. Despite the short-term upticks in precipitation observed locally, the entire region is still impacted by the longer-term, cool-season precipitation deficits that have characterized drought conditions in the Southwest over much of the past few decades.
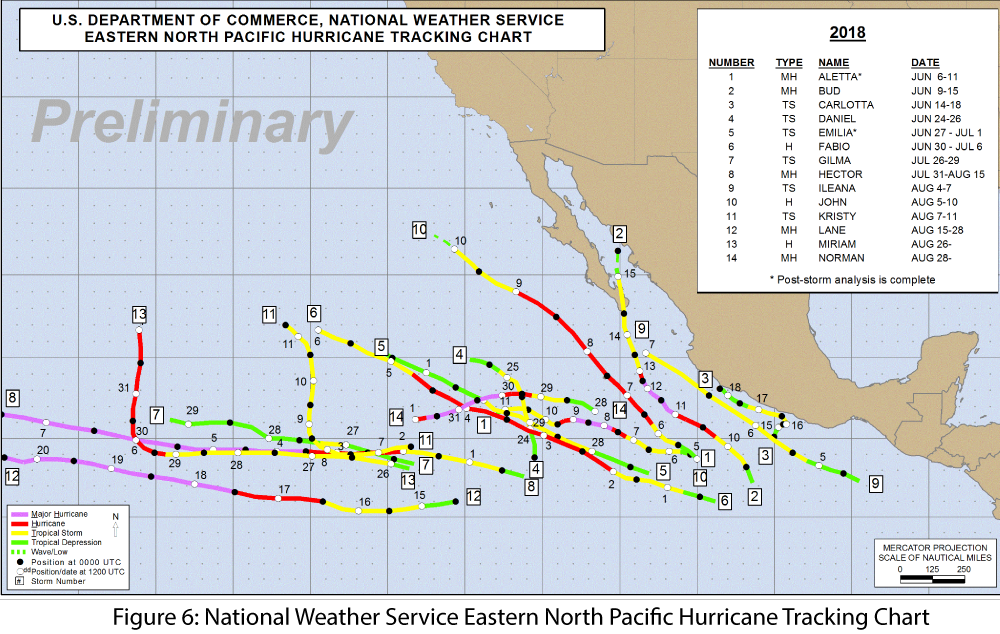
Tropical Storms: The scale and impact of Hurricane Florence in the Carolinas has occupied much of the storm-related attention recently, but the eastern North Pacific hurricane season has been quite active, with 16 named storms at the time of this writing, including 6 major hurricanes (category 4 or above). 2018 is currently the fourth most intense Pacific hurricane season, with an Accumulated Cyclonic Energy of 218 (the record is 295 in 1992). These storms have generally moved westward into the Pacific Ocean (Fig. 6), but we are approaching the part of the season when these storms are more likely to curve back into the Southwest, where they can provide supplemental moisture for convective activity or even drive precipitation events directly, as we have seen in the past with Norbert, Odile, and others.
El Niño Tracker: ENSO-neutral conditions still characterize the oceanic and atmospheric indicators, but the most recent models and forecasts continue to point toward the emergence of a fall-into-winter El Niño event as the most likely outcome. However, expectations have been scaled back from earlier predictions, with the recent forecasts suggesting a weak event rather than a possible moderate-strength event. Adding further uncertainty, the possibility also remains of an El Niño event fizzling out before it even gets started, with neutral conditions simply continuing through the fall and winter. Whether weak El Niño or ENSO-neutral, both scenarios give the Southwest a better chance of improving on the drier-than-normal conditions associated with La Niña events.
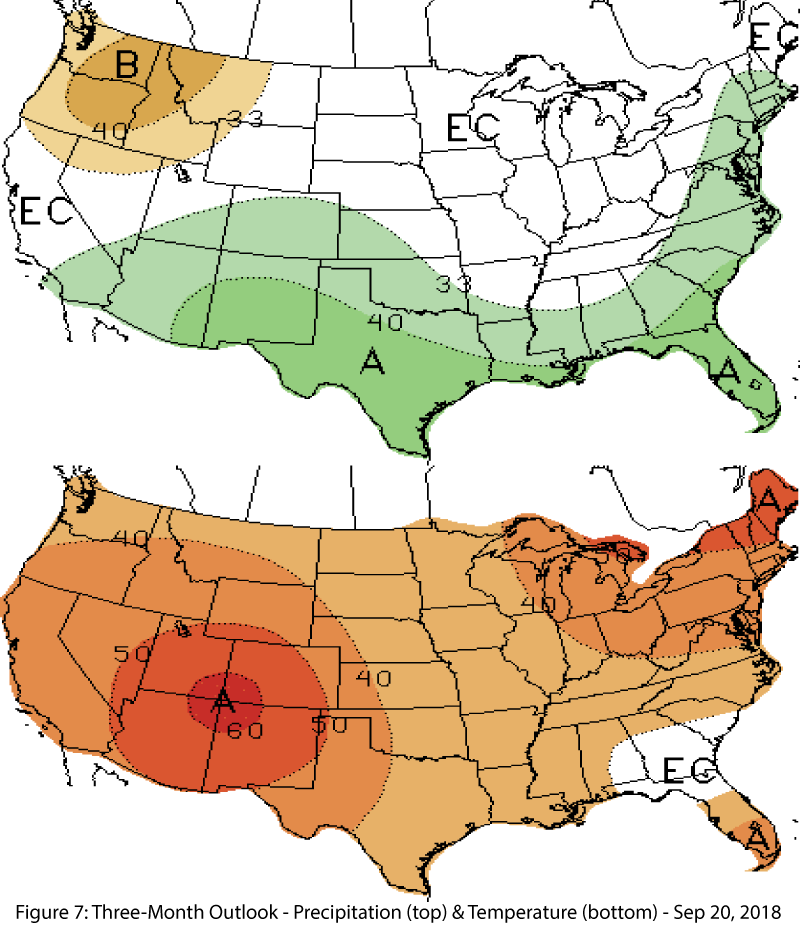
Precipitation and Temperature Forecast: The three-month outlook for September through December calls for increased chances of above-normal precipitation in Arizona and New Mexico (Fig. 7, top), and increased chances of above-average temperatures for the entire western United States (Fig. 7, bottom).