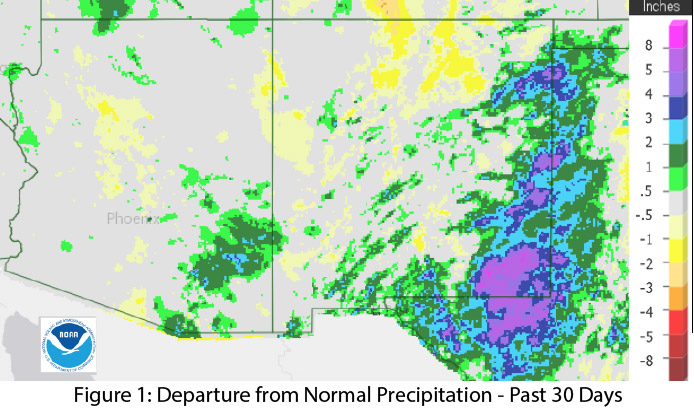
Precipitation: Over the past 30 days, most of Arizona and much of New Mexico recorded average or near-average precipitation, with notable exceptions in portions of southeast Arizona and large swaths of southeast New Mexico (Fig. 1). Even as the monsoon was wrapping up, the region had repeated incursions of tropical moisture, which brought occasional precipitation and helped keep dewpoints above expected values.
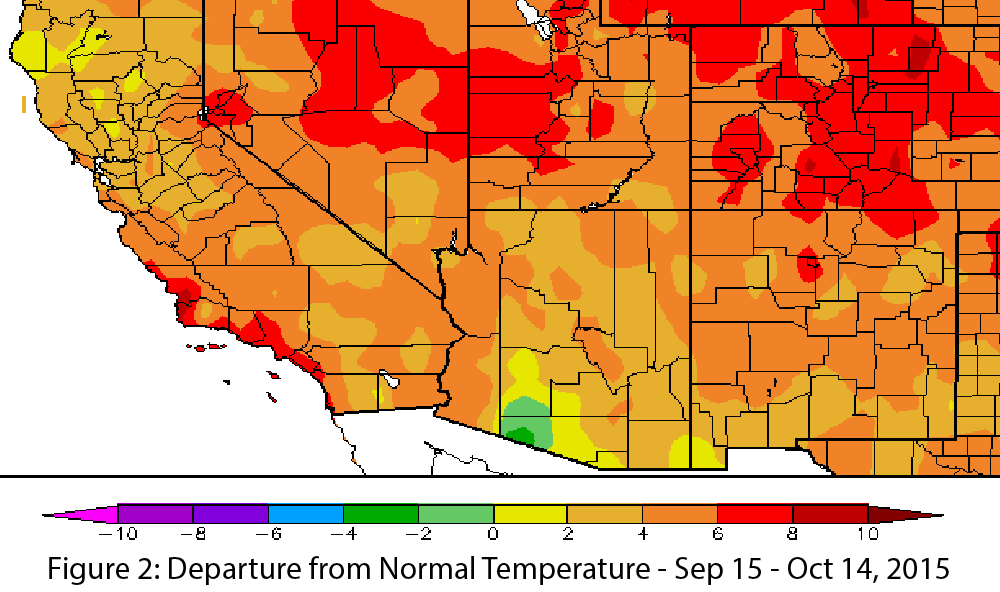
Temperature: Temperatures in the past 30 days were above average across most of the Southwest, with temperature anomalies between 0 and 6 degrees F across most of Arizona and New Mexico (Fig. 2). Average temperatures in September were record warm in New Mexico, and among the top five warmest Septembers recorded in Arizona.
Monsoon: Variable spatial coverage and intensity, along with intermittent precipitation events, makes it difficult to characterize any monsoon as “normal.” That said, 2015 has been fairly typical for monsoon precipitation; and despite a persistent break in monsoon activity for much of August and early September, most locations saw regular precipitation events that brought their total precipitation close to long-term averages (see Monsoon Recap for details).
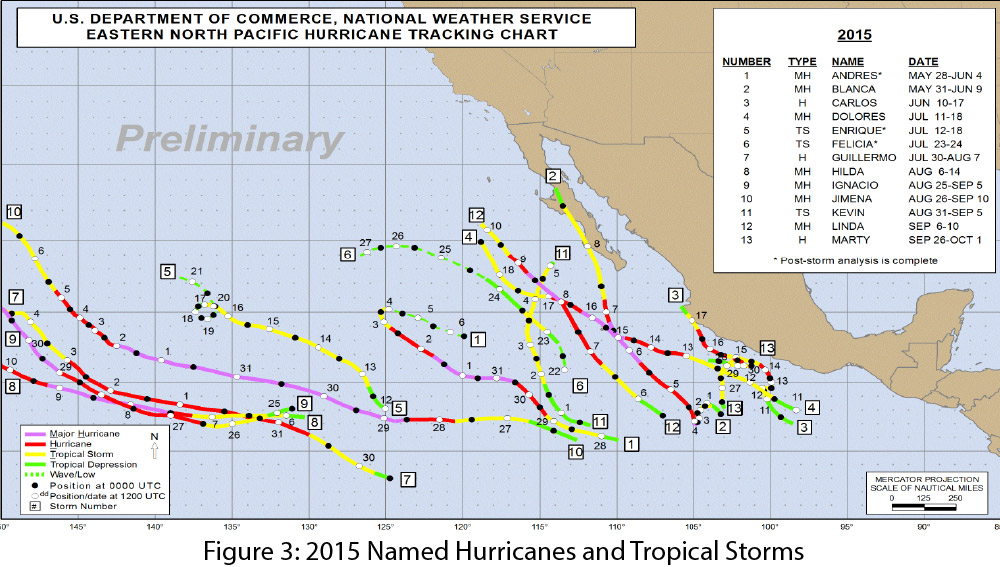
Tropical Storm Activity: El Niño events are associated with increased eastern Pacific tropical storm activity, and this year is no exception. At time of this writing, the eastern Pacific tropical storm season had recorded 10 hurricanes, seven of them major, four tropical storms, and three tropical depressions (Fig. 3). Accumulated cyclone energy (ACE) is a measure of tropical storm and hurricane strength and duration, and according to the National Hurricane Center, ACE was approximately 25 percent higher than the median value at the end of September. Activity has slowed somewhat in October, and the extent to which additional tropical systems will affect the Southwest in 2015 remains to be seen. While not directly related to monsoon circulation patterns, tropical storm activity is part of the seasonal cycle, helped buoy precipitation totals, and brought abundant moisture and persistently above-average dewpoint temperatures into the region.
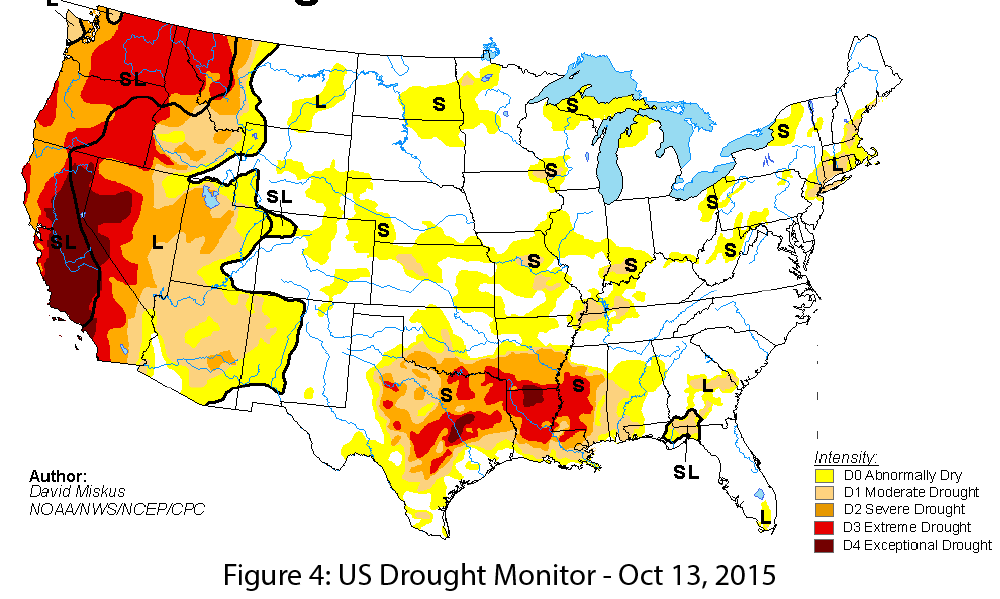
Drought & Water Supply: The U.S. Drought Monitor identifies persistent multi-year drought across the West (Fig. 4). Arizona and New Mexico are still recovering from years of accumulated drought and water deficits, but average to above-average 2015 water year precipitation (October 1, 2014 to September 30, 2015) helped alleviate drought conditions, particularly in eastern New Mexico. Years of accumulated drought are not erased overnight, and while there is hope for above-average precipitation this winter (See El Niño Tracker), the possibility remains of a rapid transition into La Niña conditions, which tend to bring below-average precipitation to the Southwest.
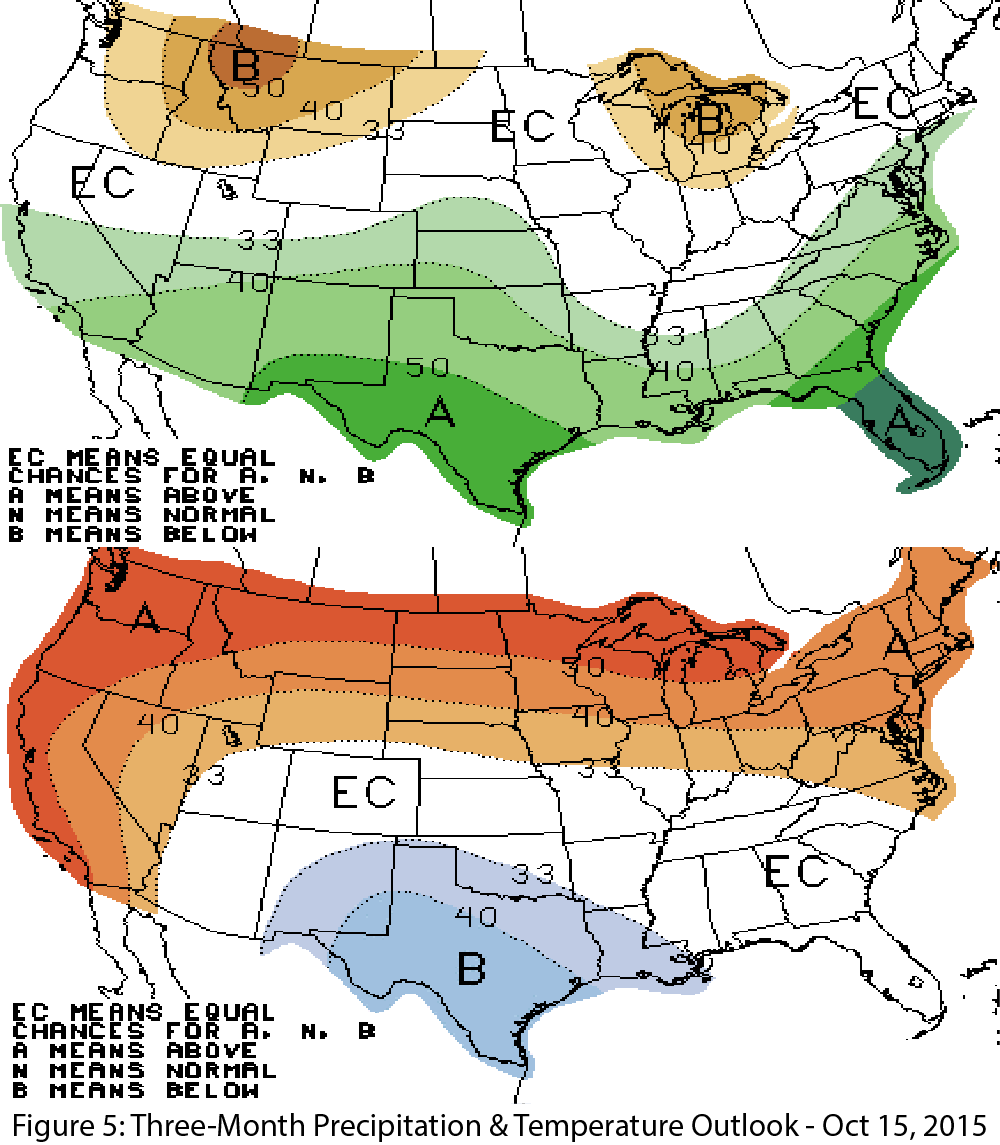
Precipitation & Temperature Forecasts: The Oct. 15 NOAA-Climate Prediction Center seasonal outlook predicts above-average precipitation for most of the Southwest this fall into winter (Fig. 5, top). Northern California and most of the Northwest are notable exceptions. Temperature forecasts are split, with elevated chances for above-average temperatures along the West Coast and extending to the western edge of Arizona, and increased chances for below-average temperatures centered over Texas and extending across most of New Mexico (Fig. 5, bottom).