Precipitation: The borderlands region of southern Arizona and portions of southern, central, and northeastern New Mexico all recorded above-average precipitation, but most of Arizona and New Mexico received average or below-average precipitation in the past 30 days despite a number of January storms (Fig. 1).
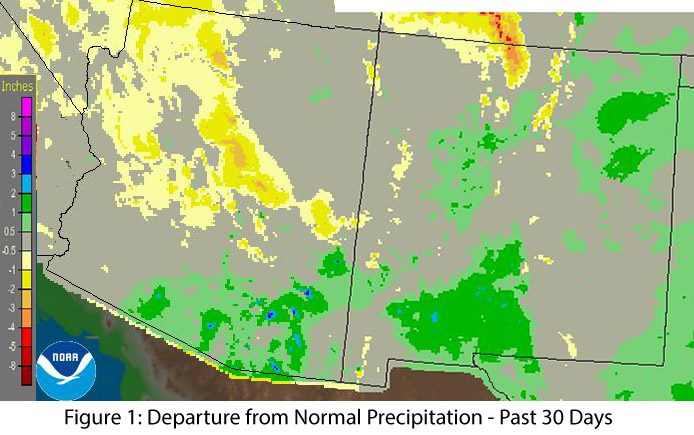
Image Source - NOAA/NWS - Advanced Hydrologic Prediction Service
Temperature: After a record year for Arizona (and a top five year for New Mexico), temperatures remained well above average in the Southwest over the past 30 days (Fig. 2). This means pleasant weather compared to the frigid and snowy conditions in the eastern and central U.S. but has implications for drought, water storage, phenology, and human health.
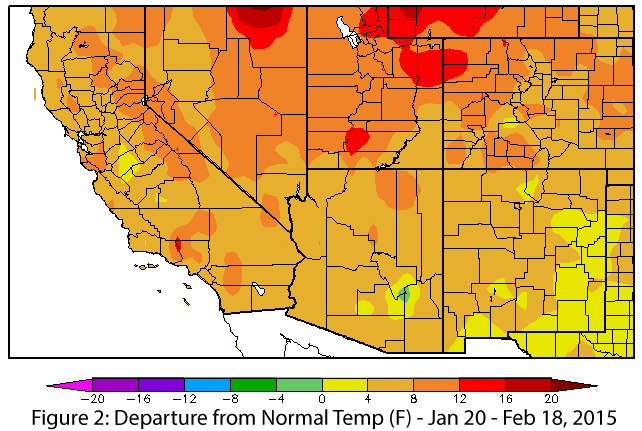
Image Source - High Plains Regional Climate Center
Snowpack: Snow water equivalent (SWE) is low across Arizona, ranging from 1 to 62 percent of average. New Mexico is also quite low, ranging from 32 to 85 percent of average (Fig. 3). Well above-average temperatures are a significant factor, as many precipitation events fell primarily as rain, with the snowline as high as 8,000 feet in some cases.
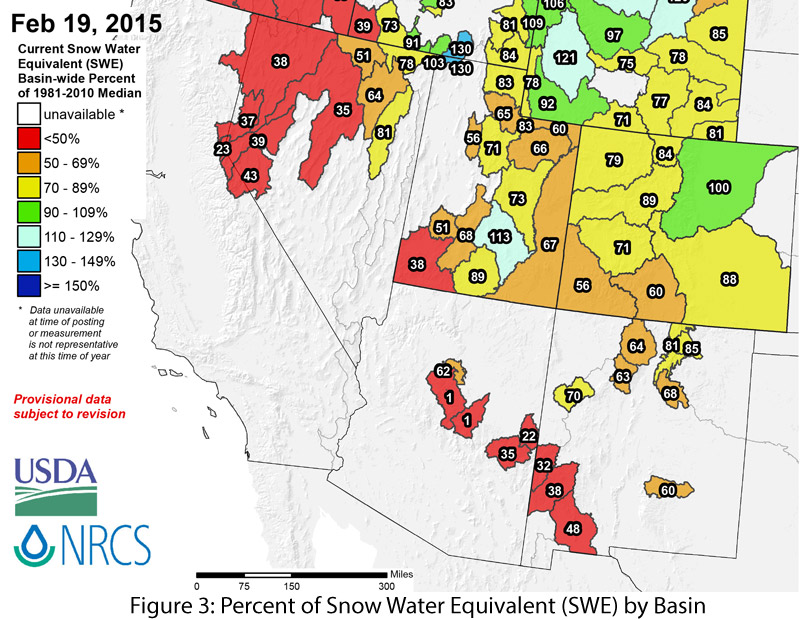
Image Source - Natural Resources Conservation Service - NRCS
Water Supply: In January, total reservoir storage was 45 percent in Arizona (compared to 46 percent last year) and 23 percent in New Mexico (same as last year) (see reservoir storage on page 5, for details). Unseasonably warm temperatures mean more precipitation falling as rain and an early start to snowmelt runoff. This may increase reservoir storage in the short term, but losses to evaporation/sublimation may counter these gains in the long term.
Drought: The 2014 monsoon, along with an active eastern Pacific tropical storm season, provided temporary relief to regional drought but did little to change long-term conditions. The U.S. Drought Monitor (USDM) expanded the drought designations in Arizona and New Mexico following variable and generally below-average precipitation (Fig. 4).
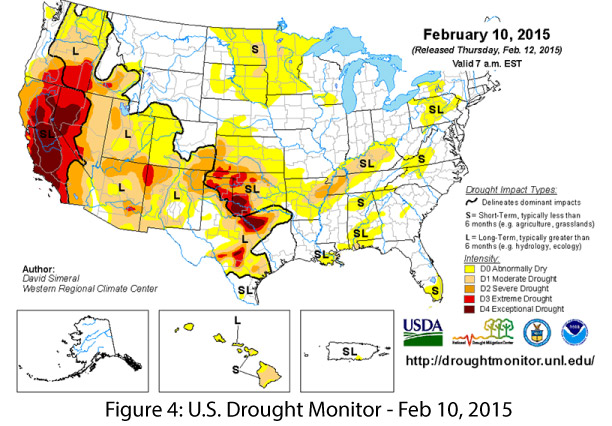
Image Source - National Drought Mitigation Center
Plant Ecology & Human Health: Above-average temperatures and winter rains jumpstarted plant activity across the region. Plant enthusiasts are anticipating a banner year for wildflowers, but this comes at a cost. Pollen counts are already at levels that affect most allergy sufferers, a pattern almost certain to extend through the spring.
ENSO: The NOAA-Climate Prediction Center maintained a 50–60% probability of an El Niño event this winter and into early spring. Declines in sea surface temperatures, especially in the Niño 1-2 region, were partially offset by increased atmospheric activity. Consensus is on a borderline weak event extending into early spring, with the potential for a resurgence of El Niño conditions later in 2015 (see ENSO tracker on page 3, for more details).
Precipitation & Temperature Forecasts: The Feb. 19 NOAA-Climate Prediction Center seasonal outlook continues to predict above-average precipitation through the winter and into spring for most of the Southwest (Fig. 5). It remains to be seen how much this forecast depends on El Niño conditions, which are currently trending weak to neutral. Temperature forecasts remain split across the region, with elevated chances for above-average temperatures along the West Coast and into Arizona and increased chances for below-average temperatures along the Gulf Coast into New Mexico (Fig. 6).
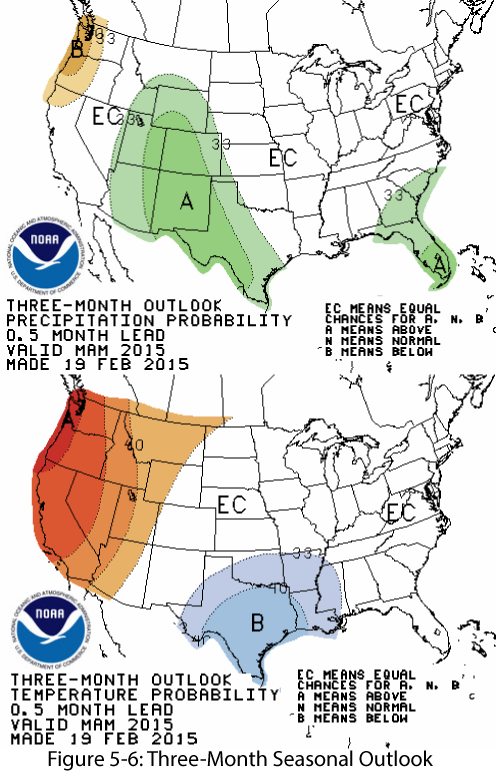
Image Source - NOAA-Climate Prediction Center