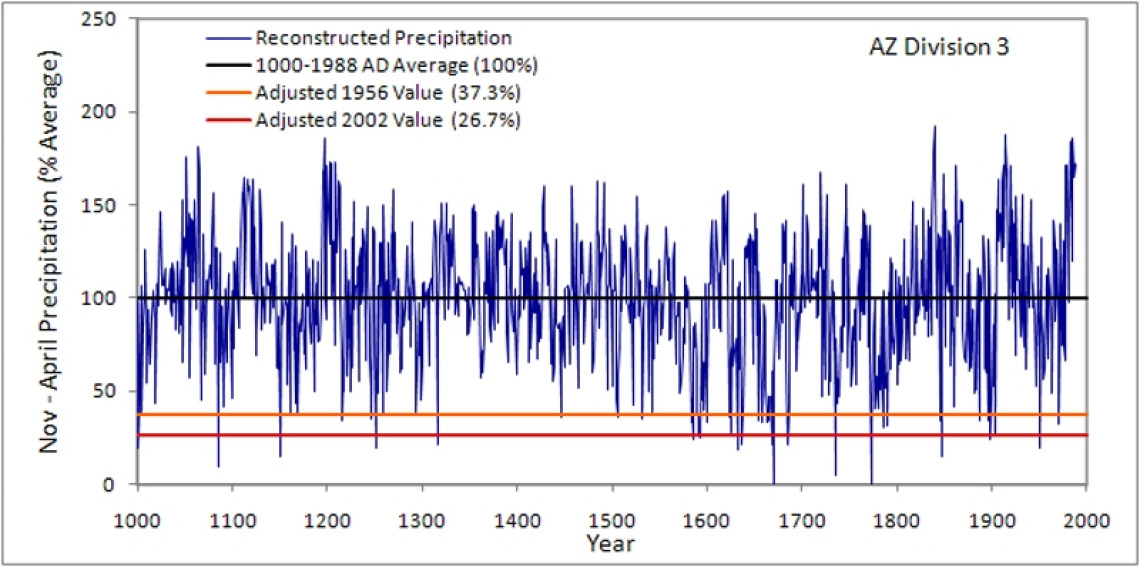
Single-Year Reconstruction and Extremes
The graph below shows the cool season (November-April) precipitation reconstruction for Arizona climate division 3. Values are expressed as a percentage of 1000-1988 average precipitation. The adjusted 2002 and 1956 averages, the two driest years during the dry periods of the 1950s and 2000s, are plotted in orange and red, respectively, for comparison. As the reconstruction shows, not many years in the past thousand years were drier than 2002.
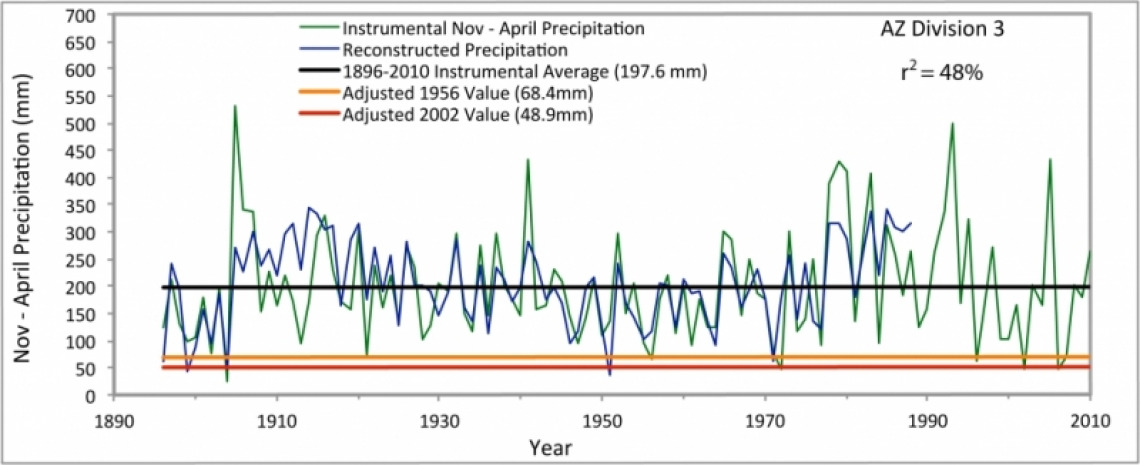
R2 = 48%
Jump to calibration/verification data
Reconstructed Average (1000-1988) = 183.1 mm
Instrumental Average (1896-2010) = 197.6 mm
| DRIEST YEAR | WETTEST YEAR | ||||
|---|---|---|---|---|---|
| Year | Precipitation (mm) | Percent Average | Year | Precipitaton (mm) | Percent Average |
| 1773 | 0.0 | 0.0 | 1840 | 351.8 | 198.4 |
| 1670 | 0.5 | 0.3 | 1197 | 340.2 | 191.9 |
| 1735 | 9.3 | 5.2 | 1064 | 332.7 | 187.6 |
| 1085 | 16.1 | 9.1 | 1839 | 327.7 | 184.8 |
| 1151 | 26.7 | 15.1 | 1052 | 321.3 | 181.2 |
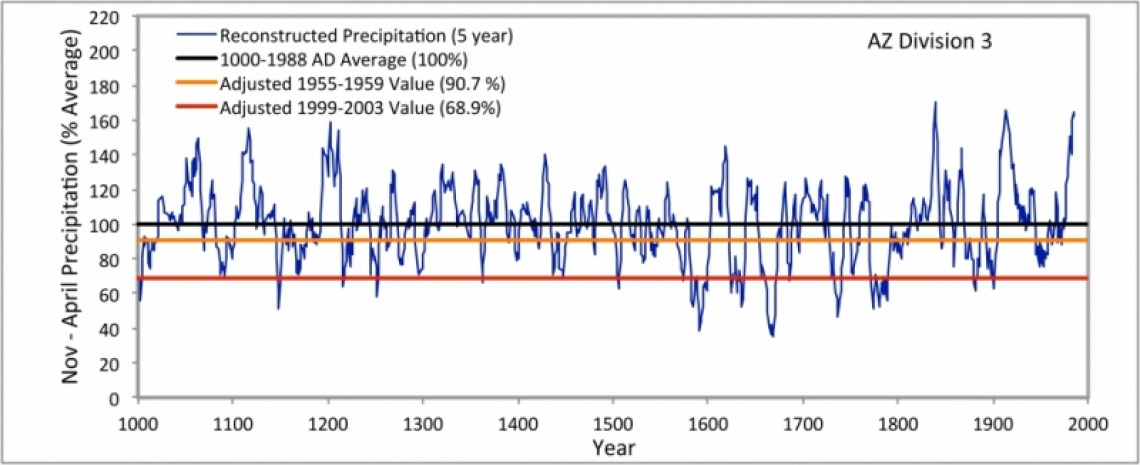
Multi-Year Reconstructions and Extremes
The graph below shows the five-year average precipitation reconstruction for Arizona climate division 3; values are expressed as a percentage of 1000-1988 average precipitation. The adjusted 1955-1959 and 1999-2003 averages for this climate division are provided for comparison (orange and red lines, respectively). These periods correspond to the driest five-year spans in the two most severe droughts in the instrumental record. Over the entire reconstructed record, several extended dry periods stand out, particularly the late 1000s-early 1100s, late 1200s, early 1300s, late 1500s, late-1700s, and the mid-1900s.
R2 = 48%
Jump to calibration/verification data
5-Year Reconstructed Average (1000-1988) = 183.0 mm/yr; 915.0 mm/5-yr
5-Year Instrumental Average (1896-2010) = 198.3 mm/yr; 991.5 mm/5-yr
| DRIEST FIVE-YEAR PERIOD | WETTEST FIVE-YEAR PERIOD | ||||
|---|---|---|---|---|---|
| Years | Precipitation (mm) | Percent Average | Years | Precipitation (mm) | Percent Average |
| 1666-1670 | 322.7 | 35.3 | 1837-1841 | 1558.6 | 170.4 |
| 1589-1593 | 348.3 | 38.1 | 1200-1204 | 1451.8 | 158.7 |
| 1735-1739 | 426.9 | 46.7 | 1115-1119 | 1417.8 | 155.0 |
| 1661-1665 | 446.2 | 48.8 | 1209-1213 | 1405.6 | 153.7 |
| 1772-1776 | 465.6 | 50.9 | 1061-1065 | 1369.0 | 149.7 |
Instrumental Record and Extremes
Precipitation was below average for climate division 3 (23.9%) in 2002, making it one of the driest years in the instrumental record. Based on five-year precipitation averages, 2001-2005 was one of the driest spells on record for this climate division.
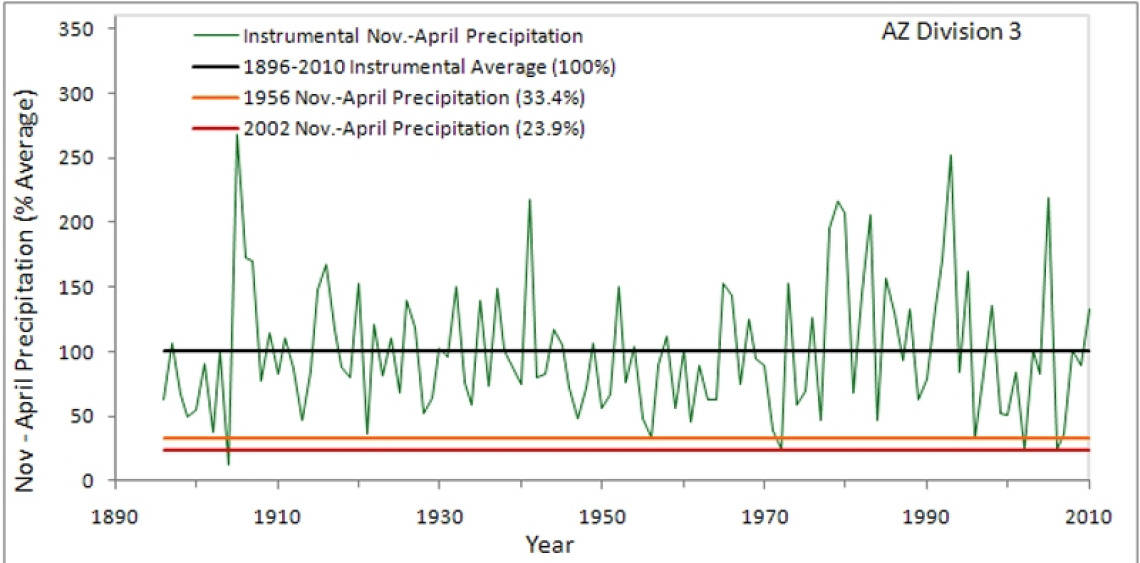
| DRIEST ONE-YEAR PERIOD | WETTEST ONE-YEAR PERIOD | ||||
|---|---|---|---|---|---|
| Year | Precipitation (mm) | Percent Average | Year | Precipitation (mm) | Percent Average |
| 1904 | 23.4 | 11.8 | 1905 | 530.4 | 268.4 |
| 2002 | 47.2 | 23.9 | 1993 | 498.6 | 252.3 |
| 1972 | 47.8 | 24.2 | 2005 | 433.6 | 219.4 |
| 2006 | 47.8 | 24.2 | 1941 | 431.5 | 218.4 |
| 1996 | 62.7 | 31.8 | 1979 | 428.2 | 216.7 |
| DRIEST FIVE-YEAR PERIOD | WETTEST FIVE-YEAR PERIOD | ||||
|---|---|---|---|---|---|
| Year | Precipitation (mm) | Percent Average | Year | Precipitation (mm) | Percent Average |
| 1902-1906 | 581.9 | 58.7 | 1982-1985 | 1664.0 | 167.8 |
| 1900-1904 | 589.8 | 59.5 | 1980-1984 | 1644.7 | 165.9 |
| 2001-2005 | 617.0 | 62.2 | 1993-1997 | 1589.0 | 160.3 |
| 1901-1905 | 655.3 | 66.1 | 1997-1911 | 1586.0 | 160.0 |
| 1957-1961 | 669.3 | 67.5 | 1978-1982 | 1564.6 | 157.8 |
Calibration and Verification Data
The graph below shows a comparison between instrumental and reconstructed November-April precipitation for Arizona climate division 3. The graph shows excellent agreement between the tree-ring and instrumental records over most of the 20th century. The R2, in this case 48%, indicates the amount of variation in the instrumental precipitation record captured by tree rings. Higher R2 values indicate more reliable reconstructions.
How the Data Were Calculated
The 1000-year reconstruction of cool-season precipitation is presented as the combined neural network and linear regression reconstructions. The two separate reconstructions were combined in the following manner. If both the linear regression and neural network reconstructions were below the calibration in any given year, then the linear regression value was used. In all other instances, a simple average of the two reconstructions was used. The rationale for this approach is based on detailed analyses and the simple observation that the linear regression does a better job at capturing the drought years. The reconstructions for each division were “smoothed” using a centered 5-year running average.
These reconstructions were developed using millimeters as the measurement unit. However, it is sometimes easier to think of precipitation in terms of the percentage of the long term average. To convert these data to percentage of average each reconstructed value was simply divided by the average of the reconstruction. The same procedure was used to convert instrumental precipitation.
The threshold line for the most recent drought period was calculated by first determining the percentage of average precipitation received during the year or averaged over the last five years, then dividing by the long term averages. In the case of the five-year smoothed reconstructions the average is based on five year averages over the 1896-2010 period. Comparison of the most recent drought in the 2000s to the long term average is problematic, however, because these reconstructions only extend through 1988. In addition, tree-ring data do not match the variance contained within the instrumental data so an adjustment is needed to be made in order to make more reasonable comparisons. The 2002 value (or the 5 year average) was first adjusted relative to the 1896-1988 reference period by calculating the percentage of average over the entire period (1896-2010), then determining the value relative to only the common overlap period (1896-1988). For example, Arizona Climate Division 3 recorded 47.2 mm of precipitation in 2002, which is 23.9% of the 1896-2010 average (197.7 mm). To put this into the context of the tree-ring reconstruction in terms of millimeters of precipitation, this value (23.9% or 0.239) was multiplied by the reconstructed average over the period 1896-1988 (204.5 mm), which yields an adjusted value of 48.9 mm.
A note about dates: while a single year or range of dates is given in the data for simplicity, cool-season precipitation estimates are for November-April. For example, data listed for 2002 would actually be from November 2001 to April 2002.