Southwest Climate Outlook Monsoon Tracker - September 2018

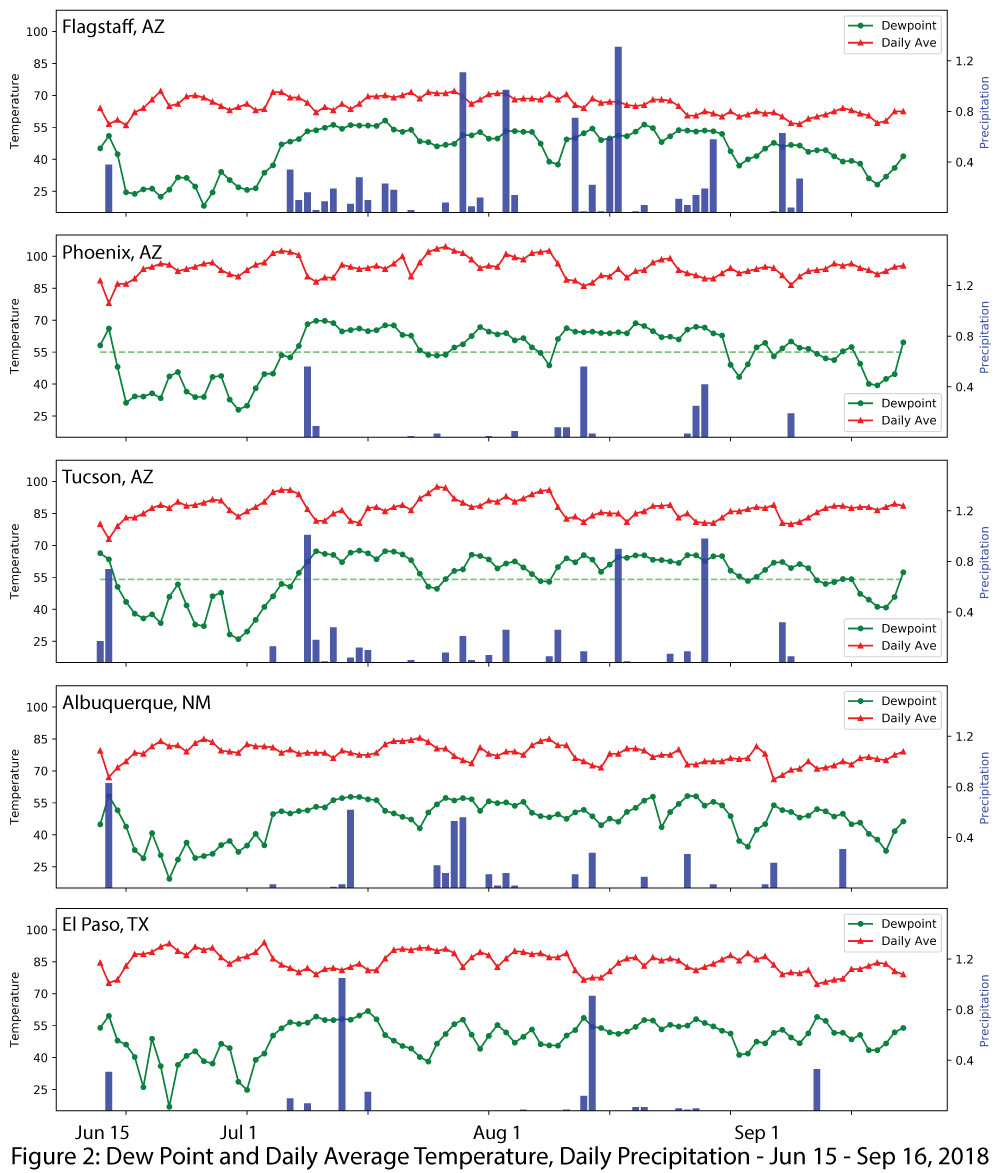
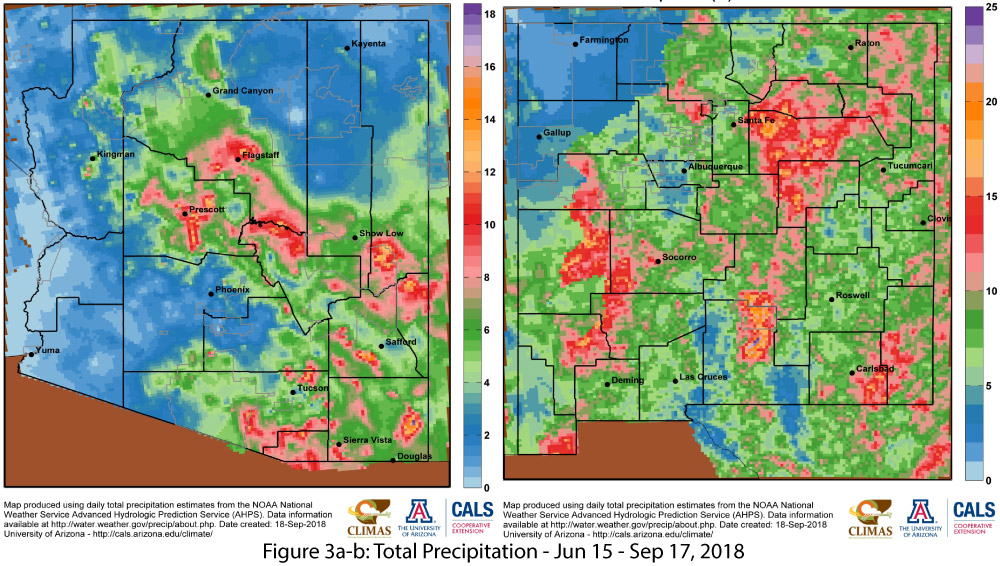
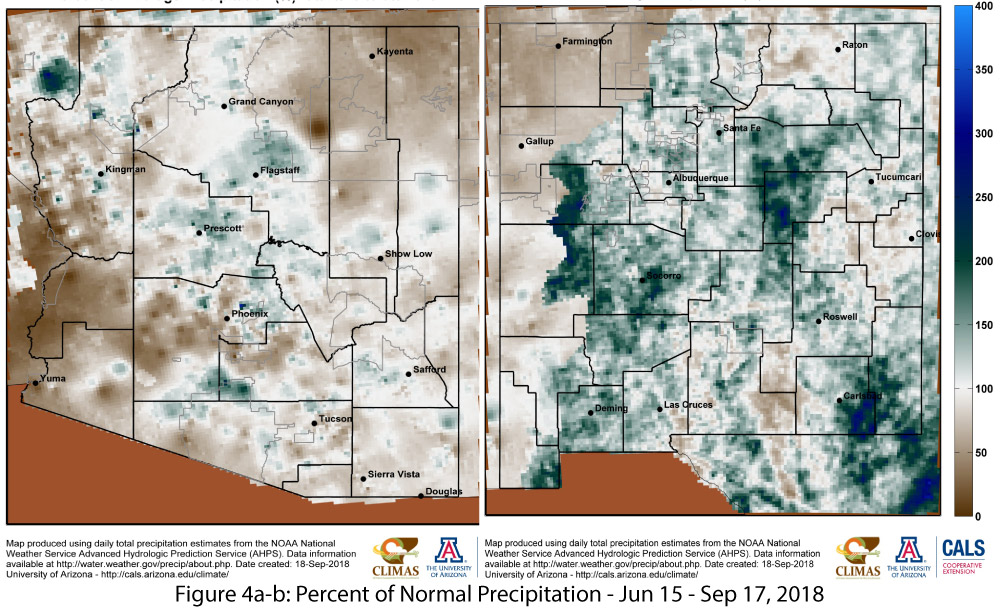
Monsoon precipitation varies considerably in space and time across the Southwest, as illustrated by monthly totals for various stations. (Fig. 1). Statewide patterns highlight widespread areas of both above- and below-average totals (see Fig. 4 on p. 5). The Fig. 2 plots of daily precipitation, temperature, and dewpoint temperature for the same stations as Fig. 1 capture the intermittent nature of monsoon precipitation as well as the persistent elevated dewpoint most locations experienced this summer.
In many years, breaks in monsoon activity (sometimes for extended periods) occur, characterized by decreased humidity and increased temperatures. While we had fewer such intervals this year, that was no indicator of consistent precipitation (El Paso and Phoenix are both good examples). As noted last month, sustained periods of high dewpoints without precipitation led to extreme heat warnings in the region and persistent warm overnight temperatures. Without storm-induced cooling, elevated dewpoint temperatures can be downright miserable, especially for households that rely on evaporative coolers for interior climate control.
At the time of this writing (Sept. 20, 2018), southern Arizona had just experienced a surge in tropical moisture that drove storm activity on Sept. 18-19, with preliminary reports of over three inches of rain in some locations, and widespread precipitation across southern Arizona (more on this and tropical storm activity next month).
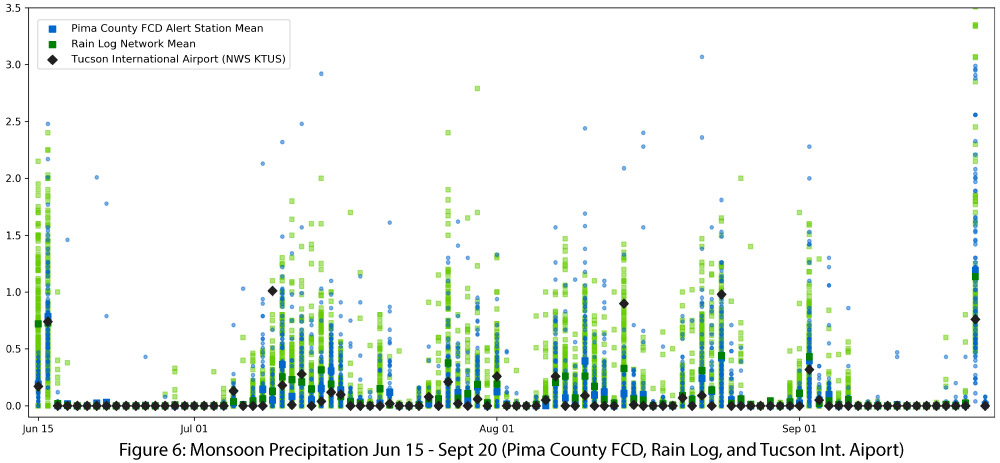
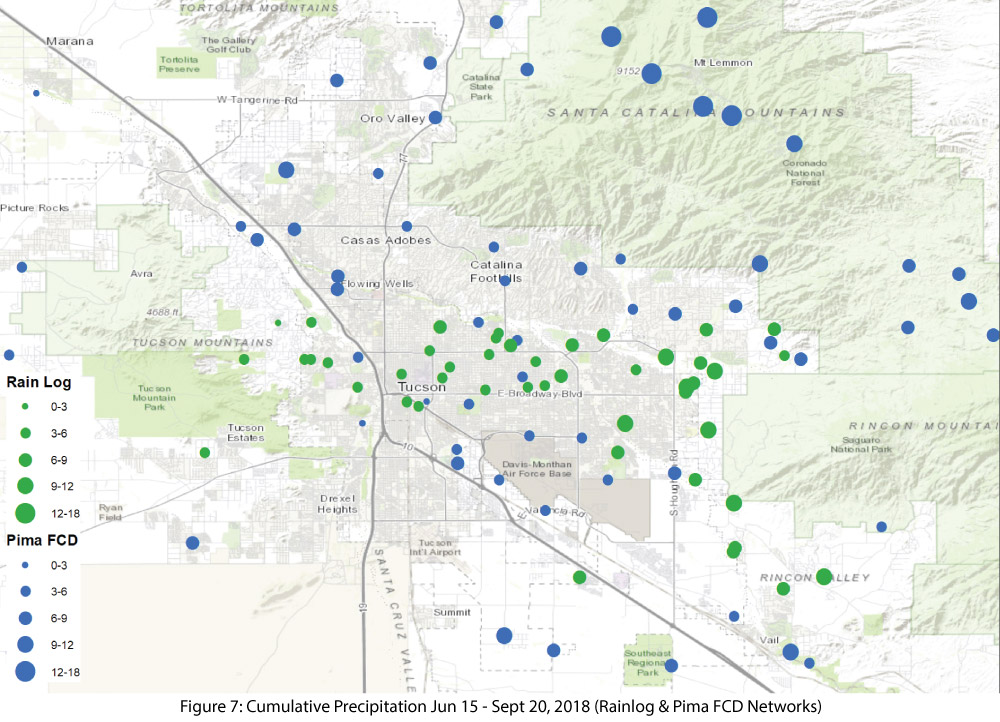
A look at monsoon precipitation across the Tucson metropolitan area illustrates the spatial heterogeneity of monsoon events. Some areas receive frequent and/or abundant precipitation, while others–often nearby–do not (Figs. 6-7). Individual stations (e.g. the Tucson Airport) track long-term comparisons to normal at that single location, but cannot capture this variability. Higher elevation areas are expected to receive more precipitation, but the range found in lower elevation locations highlights how daily and cumulative totals can vary across a remarkably short distance.
CLIMAS has a new project in collaboration with the National Weather Service in Tucson exploring how to integrate citizen science rainfall observations into monsoon analysis and visualizations, and to compare these observations to official stations and radar derived estimates of precipitation. If you have any questions or want more information, contact Ben McMahan at bmcmahan@email.arizona.edu. - RainLog: rainlog.org - CoCoRaHs: cocorahs.org
Online Resources
-
Figures 1-2 - CLIMAS: Climate Assessment for the Southwest - climas.arizona.edu
- Figure 1 Data: wrh.noaa.gov/twc/monsoon/monsoon_elp.php
- Figure 2 Data: mesowest.utah.edu/
- Figures 3-5 - UA Climate Science Application Program - cals.arizona.edu/climate
-
Figures 6-7 - CLIMAS: Climate Assessment for the Southwest - climas.arizona.edu
- Data: NWS-Tucson, RainLog.org, & Pima County Flood Control District